5

Apart from the fact there exist special functions to plot vector fields, I have encountered a strange Matlab behaviour: Plotting an image (with imagesc or imshow) and overlaying it with colored lines (with plot or line) leads at some point to an erasement of the background image.

%% some data...
% random image
Image = rand(200,400);
% 900 lines of random color
color1 = rand(1,900);
color2 = rand(2,900);
color3 = rand(3,900);
% some positions
x = 31:60;
y = 31:60;
[X,Y] = meshgrid(x,y);

%% plot process
% plot Image (with 'imshow' or 'imagesc')
imshow(Image);
hold on;
% plot the lines (with 'line' or 'plot')
for i = 1:900
    line([X(i), X(i)+1],[Y(i),Y(i)+2],'color',[color1(i),color2(i),color3(i)]);
    if i == 100 % nothings happens to background image after 100 vectors
        pause();
    elseif i == 200 % gradually starts to change...
        pause();
    end
end
% ... at the end it is completely erased

Result: 100 lines

after 100 lines

Result: 200 lines

after 200 lines

Result: 900 lines

after 900 lines

Nice side fact Saving the image as PNG restores the image (but destroys the line resolution).

matheburg
  • 2,097
  • 1
  • 19
  • 46
  • 1
    hich version of Matlab is this? Is it the new figure handle thing? – Ander Biguri Nov 26 '14 at 10:10
  • What happan at 400? 600? Have you tried `hold on` also after the `line` command? Maybe it's contrast issue, can try also `imshow(Image,[])`? – Adiel Nov 26 '14 at 10:20
  • @Ander Biguri: Matlab version: R2012b (8.0.0.783) – matheburg Nov 26 '14 at 10:28
  • @Adiel This also was my intuition at the beginning, but since I have played around with this idea and in the MWE everything is in [0,1] I am quite sure this is not the case. Even more important, the behaviour could not be explained this way... – matheburg Nov 26 '14 at 10:31
  • But the colored pixels aren't in [0,1] ? – Adiel Nov 26 '14 at 10:36
  • @Adiel probably I misunderstand you (or the other way around), but `rand` only produces values in [0,1] – matheburg Nov 26 '14 at 10:39
  • 3
    This doesn't happen in Matlab 2014b win7x64 computer. I have the random image and the small square full of colors without a problem. My guess: matlab,s figure handle (programed in java if I am not wrong) goes deleting the image becasu it has not enough ram to save all the data on screen. Test this: make an smaller/bigger image and test if this happens slower/faster. – Ander Biguri Nov 26 '14 at 10:44
  • Yes' you right. But I still think it has something with the contrast. If you'll enlarge the images you can see that the 100-lines image has many gray levels, while the 200-lines has only 3: black-gray-white. You can try also `imagesc`. – Adiel Nov 26 '14 at 10:49
  • @Adiel I dont thing it will be the contrast. I just copypasted his code and I dont get that effect. – Ander Biguri Nov 26 '14 at 10:51
  • I have no Matlab here... I'm curious to wait to some other users that will check it.. It strange also because in the png. format it's ok – Adiel Nov 26 '14 at 10:53
  • @Adiel That is not too surprising since both are rendered differently. Although the Matlab-figure doesn't display all data it is still available in the background... – matheburg Nov 26 '14 at 14:06
  • @AnderBiguri: That's interesting - so it really seems to be a 2012b-bug... – matheburg Nov 26 '14 at 14:08
  • Still try for different image sizes and see if its a problem of the garbage colector of the ploting function. – Ander Biguri Nov 26 '14 at 14:15
  • Try using `set(gcf(),'NextPlot','add'); set(gca(),'NextPlot','add'); setappdata(gca(),'PlotHoldStyle',true);` instead of `hold on`. I am unable to test because the bug doesn't exist in R2015a. – transversality condition Aug 08 '15 at 19:29

1 Answers1

0

This is not properly an answer, as it doesn't exactly explain why this is happening, but it provides a workaround, along with some more observations of the weird behaviour.


Scope:

I tried your example and indeed:

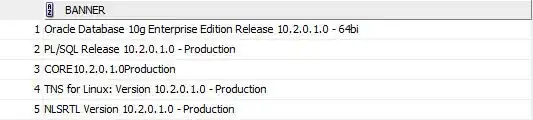
  • pre HG2 (R2013a): Same behavior than you described
  • HG2 (R2015a) : No problem, everything is there.

Workaround:

After a few trial and error, I worked out that it is a specific behaviour of the painter renderer in pre HG2 versions.

If you change the renderer to any other than the default painter, you get back your image and your superimposed lines.

set(gcf,'Renderer','zbuffer')
%// OR
set(gcf,'Renderer','opengl')

Observations:

Note that I also tried to:

  • display the lines first (no problem), then the image (and reorder using uistack) => same black image.
  • use multiple axes => black frame

mult

And to show you how persistent is the glitch:

  • if you delete all the lines, the image does not reappear (=black frame).
  • if you delete all graphics objects, then re display the image => black frame
  • if you cla or even clf then re display the image => black frame

The only way I found to get the image displayed is to change the renderer as described above.


Printing/Saving

Initially, I thought the change of renderer was happening behind the scene when you were saving the figure, thereby allowing the final output to be fully displayed. Unfortunately, by exploring a bit more it doesn't seem to be so simple.

I tried different version with print (instead of saveas) since it allows you to select the renderer. For each renderer I chose 2 formats, PDF which uses the ghostscript engine, and PNG which uses the Matlab engine:

%%
print(1,'-dpng','-painters','testimageP.png')
print(1,'-dpng','-zbuffer' ,'testimageZ.png')
print(1,'-dpng','-opengl'  ,'testimageO.png')
%%
print(1,'-dpdf','-painters','testimageP.pdf')
print(1,'-dpdf','-zbuffer' ,'testimageZ.pdf')
print(1,'-dpdf','-opengl'  ,'testimageO.pdf')

Well, after results I am still unsure of what is happening. All these saved figures show the proper image and the lines on top... But:

The 3x png images (Matlab engine) are exactly similar. They do not even show slight difference in saturation like you can observe when you switch the renderer manually. This made me think that Matlab chose to ignore my renderer specification. It just decided which one was the most relevant and went ahead printing 3 times the same figure. So I thought may be the painter renderer wasn't used and that's why the images were shown.

Well not so fast. On the 3x pdf images (ghostscript engine) ... I can observe the small nuances between the 3 pictures ... so the renderer wasn't the same between them. The painter was used on one of them, and successfully rendered the image.


So in conclusion, it seems the painter renderer is only glitchy when applied to a (pre-HG2) figure!

Hoki
  • 11,637
  • 1
  • 24
  • 43