This is a little complicated to explain. I have time series data formatted like this: https://docs.google.com/spreadsheets/d/1B8mN0uD-t4kQr2U20gS713ZFHN6IgGB7OMR3-pqJjrw/edit?usp=sharing
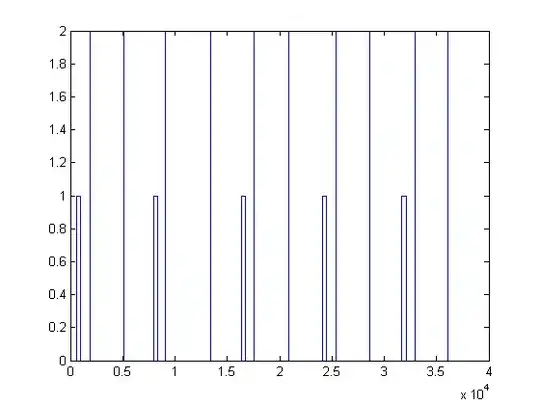
That data represents voltage recordings at .01s intervals. When plotted it looks like this:

Essentially what I want to do is find the time at which the first peak in each very narrow pair occur (ie at ~.1, .75, 1.6, etc).
The time values are in a separate array, but the index values (row numbers) correspond between the two sets.
Any ideas on how to do this?
My initial attempt was something like this from the matlab manual
function [edges2] = risingEdge2(time, data)
threshold = 0.4;
offsetData = [data(2:end); NaN];
edges2 = find(data < threshold & offsetData > threshold);
end
I couldn't figure out a good way to ignore for n seconds after the first peak...I'm also getting many more peaks than expected...probably because of noisy data.