0

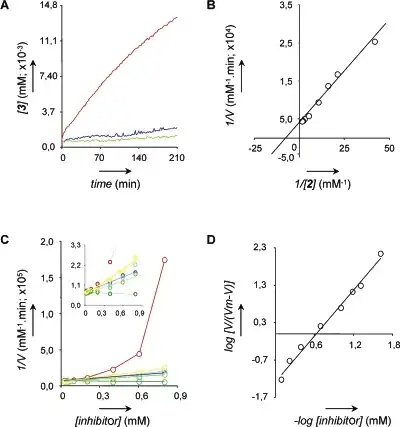
I have to draw some graphics (pyplot preferred, but not mandatory), but on a very specific way. Here is an example of what I want:

example

I already know how to use pyplot to get most of the things I want. What I don't know:

  • How can I name the graphs ? (A, B, C, D...). I also would like to be able to set the position of the letter, like on the picture. On the top left corner.

  • Is there a way to include an arrow for the axis, like on the picture ? I don't have much hope for this one. Maybe I can use LaTex in the legend of the axis, and include something like \arrow ?

Community
  • 1
  • 1
JPFrancoia
  • 4,866
  • 10
  • 43
  • 73

1 Answers1

1
  1. Removing the axes spines to the right and top:

    To remove the spines on the right and top, you could call:

    for spine_loc in ('top', 'right'):
        ax.spines[spine_loc].set_visible(False)
    

    Next, you'll want to call these functions to also remove the ticks:

    ax.yaxis.set_ticks_position('left')
    ax.xaxis.set_ticks_position('bottom')
    
  2. To set the position of the title, you could use the set_position method of the axis title instance:

    title = ax.set_title('test')
    title.set_position([-0.1, 1])
    

    The coordinates seem to be axes fraction and I haven't found a way yet to specify figure fraction or any of the other options common to e.g. ax.annotate. But this 'll get you where you wanted to go and it also makes sense, because the title here is linked to an axes instance, not to e.g. a figure window.

  3. Adding arrows to indicate the direction of increasing coordinates: Arrows can be plotted easily, just use annotate and specify the arrowprops, while leaving the string empty. The generated arrow can be positioned anywhere, even outside the axes, by specifying the right options for xycoords and textcoords. Although, you could just as easily specify the overlined arrow in Latex for your xlabel (or ylabel):

    ax.set_xlabel(r'$\overrightarrow{X} (\mu{m})$')
    

    But I think that's not exactly what you want, because the arrow only seems to indicate the direction of increasing ordinates in those graphs. In that case, the arrow there is chartjunk, but of couse that's your choice.

You should also have a look at the axisline example from matplotlib, which shows how to use the SubplotZero class. It makes it relatively easy to have two spines crossing at (0,0), like most of us are used to in high school. The example also tackles issues (1) and (3) described here.

Oliver W.
  • 13,169
  • 3
  • 37
  • 50