10

I was writing a new code base in opengl and have encountered a weird bug very early on. It is a distinct fluctuation in framerate that is repetitive and predictable.

I know that it is definitely proportional to objects rendered. It is also proportional to screen size (not viewport size, not window size, just physical device size) It is roughly a ratio of 0.2:1 (low:high) frames

I got curious and graphed it, bear in mind that the window/context isn't vsynced or capped. Object count and screen size comparisons
The view is completely stationary and all objects are stationary. Each frame is exactly the same. No input was given at any time. There is nothing time-based. No garbage collection happens.

I don't get it, if it is basically one frame being rendered over and over what could cause such a great change?

Here's the pseudo code of program flow

create window
load shaders
grab uniform locations
create camera
create 3 meshes // They just hold the buffers and data for a model
create x objects and pass a pointer to a random mesh // Objects hold position, rotation etc + link to mesh
while game is running
    poll window for events
    capture mouse and recalculate VP matrix if required
    for each object
        recalc MVP
        bind mesh's buffers and draw elements
    draw window //SFML handles this, just swaps front/back buffers and draws
clean up data

If this gives no insights then I uploaded the VS2012 project to github: https://github.com/Twistedsnail/Untitled_for_SO(it probably won't run locally because it requires SFML2 in a specified location and GLM in VS's files)

Nathan Wride
  • 965
  • 1
  • 7
  • 28
  • It would probably help if we could see the code. If it's to long to include in the question, there are places where you could post it and add a link in your question here. Also, is it old (fixed pipeline) or new (programmable pipeline w. shaders) OpenGL? – Some programmer dude Sep 07 '14 at 19:31
  • Shaders targeting GL4.1. I'll upload the code when I have a chance later today. – Nathan Wride Sep 07 '14 at 19:48
  • 2
    I once had a very similar problem with CUDA. About every 200ms I'd experience a 2ms delay between kernel executions (where each cycle in the kernel execution would be identical). I never got to the cause of the problem, because at some point in the development process it vanished and I couldn't be bothered to bisect the change history. – datenwolf Sep 07 '14 at 20:53
  • What is "samples"? What are the numbers on x-axis? (time? frame number?) – Ivan Aksamentov - Drop Sep 07 '14 at 22:48
  • x axis is number of frames (samples each frame) y axis is FPS (1/frametime) – Nathan Wride Sep 07 '14 at 22:49
  • The time between the fps drops seems to be pretty consistently around 0.5 seconds. Would it be possible to plot the data using elapsed time for the x-axis, to see if this is true? – Reto Koradi Sep 08 '14 at 04:28
  • 1
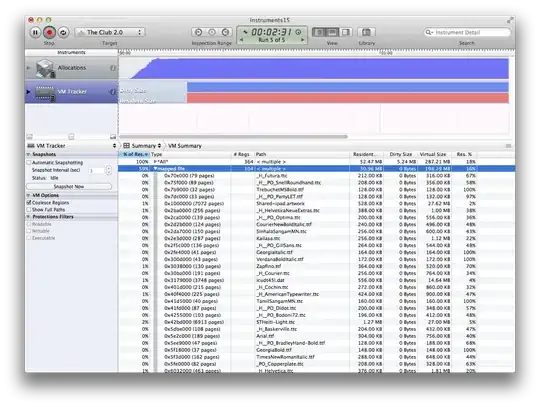
    In any case, you would need to use tracing tools that can track various types of system activity to have a chance to fully understand this. Something like Instruments if you're using a Mac, but there must be similar tools on other systems. The most obvious guess is that there's another process/service running on the system that generates periodic activity, taking CPU time or other system resources away from your application. – Reto Koradi Sep 08 '14 at 04:33
  • Glad this isn't Java, otherwise the GC bashing could start now. Some further information *might* be interesting, although hard to say whether it's relevant: Particularly the Graphics Card and Driver version (e.g. does it only happen on NVIDIA or AMD cards?) – Marco13 Sep 08 '14 at 08:04
  • 1
    I think @Reto Koradi may have the right origin of this problem: an other process is running and get your CPU/GPU, which influence the FPS. – Adrian Maire Sep 08 '14 at 08:39
  • Now I'm really at a loss, after commenting out various sections of the loop I discovered it wasn't the rendering, the matrix math, the event polling or the window tweaking. I tested the program when the loop contained the frametime counter, only the frame counter. The results are the same, there is a rhythmic fluctuation in frametime. Only when my program is running. What the hell man? – Nathan Wride Sep 09 '14 at 06:14

1 Answers1

3

When we were building a game engine at my last job we also had curious problems like that from time to time.

Causes I remember:

  • Lua garbage collection. Where were using Lua as scripting language for the engine and the GC would make it appear as if there was problem with the rendering! Though it was not obviously. Check for any other threads or even processes that might become greedy in your application/machine.

  • OpenGL driver issues: disabling or enabling "Threaded Optimization" in the NVIDIA driver had funny effects on performance like this sometimes. ATI drivers more often simply had bugs which required an upgrade.

  • Problems with the Windows event loop. Like using GetMessage instead of PeekMessage.

Another thing: If you are really not rendering much and have several thousand FPS: even the slightest increase in rendering time will have "huge" effects on your FPS. So what you are seeing might be very normal operating system/driver tasks that are irrelevant when working with "normal" game FPS like 60 to 120 and not much noticeable later.

Peter O.
  • 32,158
  • 14
  • 82
  • 96
Nico Heidtke
  • 525
  • 4
  • 7
  • Interesting. I'll keep you guys up to date as I go. You're right btw about the framerate – Nathan Wride Sep 08 '14 at 13:07
  • I don't think it's normal operation: look at the ratio between the high and low points, it's roughly the same (3.75 ~ 300 / 80 or 7500 / 2000). If it were a small task taking only little CPU, then the effect should be negligible for the 300 fps high runs. – BeyelerStudios Sep 08 '14 at 16:10
  • New Update: I had a bug in my code, all framerates are have an extra 0, that means its falling from around 30 to 7.5 and 800 to 150. That seems more significant. – Nathan Wride Sep 08 '14 at 17:02
  • Also I monitored my whole pc CPU usage, the total usage has a sinusoidal pattern, and it's not 1 program rising and falling, everything oscillates (with larger programs shifting between 16% to 10%) – Nathan Wride Sep 08 '14 at 17:04
  • But it does only oscillate when my program is running. Did anyone feel brave enough to inspect my code on github? – Nathan Wride Sep 08 '14 at 17:05
  • 2
    I did donwload it. Didn't see any obvious problem there. I guess debugging and some more detailed measurements should do the trick. Dont ask me if i will do that, because I'm currently not bored ;-) sorry. – Nico Heidtke Sep 09 '14 at 22:26