17

Please see my plot below: enter image description here
my code:

 > head(data)
              X0      X1      X2       X3       X4       X5       X6        X7        X8        X9
 NM_001001144 6.52334 9.75243 5.62914 6.833650 6.789850 7.421440 8.675330 12.117600 11.551500  7.676900
 NM_001001327 1.89826 3.74708 1.48213 0.590923 2.915120 4.052600 0.758997  3.653680  1.931400  2.487570
 NM_001002267 1.70346 2.72858 2.10879 1.898050 3.063480 4.435810 7.499640  5.038870 11.128700 22.016500
 NM_001003717 6.02279 7.46547 7.39593 7.344080 4.568470 3.347250 2.230450  3.598560  2.470390  4.184450
 NM_001003920 1.06842 1.11961 1.38981 1.054000 0.833823 0.866511 0.795384  0.980946  0.731532  0.949049
 NM_001003953 7.50832 7.13316 4.10741 5.327390 2.311230 1.023050 2.573220  1.883740  3.215150  2.483410

pd <- as.data.frame(scale(t(data)))
pd$Time <- sub("_.*", "", rownames(pd))
pd.m <- melt(pd)
pd.m$variable <- as.numeric(factor(pd.m$variable, levels =     rev(as.character(unique(pd.m$variable))), ordered=F))
p <- ggplot(pd.m, aes(Time, variable))
p  + geom_tile(aes(fill = value)) + scale_fill_gradient2(low=muted("blue"), high=muted("red")) +
  scale_x_discrete(labels=c("0h", "0.25h", "0.5h","1h","2h","3h","6h","12h","24h","48h")) + 
   theme_bw(base_size=20) + theme(axis.text.x=element_text(angle=0, vjust=0.5, hjust=0, size=12),
   axis.text.y=element_text(size=12), strip.text.y=element_text(angle=0, vjust=0.5, hjust=0.5, size=12),
   strip.text.x=element_text(size=12)) + labs(y="Genes", x="Time (h)", fill="")

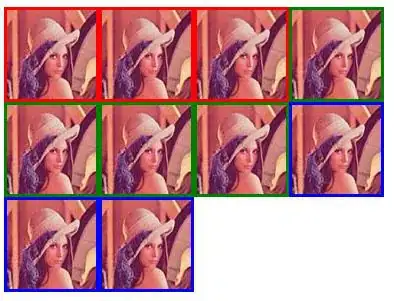
Is there a way to cluster the plot so that the plot displays the dynamics in the time course. I would like to use the clustering that comes out of:

 hc.cols <- hclust(dist(t(data)))
enter image description here

Rich Scriven
  • 97,041
  • 11
  • 181
  • 245
user3741035
  • 2,455
  • 4
  • 15
  • 20

3 Answers3

15

You can achieve this by defining the order of Timepoints in a dendrogram after you have applied hclust to your data:

data <- scale(t(data))
ord <- hclust( dist(data, method = "euclidean"), method = "ward.D" )$order
ord
[1]  2  3  1  4  8  5  6 10  7  9

The only thing you have to do then is transforming your Time-column to a factor where the factor levels are ordered by ord:

pd <- as.data.frame( data )
pd$Time <- sub("_.*", "", rownames(pd))
pd.m <- melt( pd, id.vars = "Time", variable.name = "Gene" )

pd.m$Gene <- factor( pd.m$Gene, levels = colnames(data), labels = seq_along( colnames(data) ) )
pd.m$Time <- factor( pd.m$Time, levels = rownames(data)[ord],  labels = c("0h", "0.25h", "0.5h","1h","2h","3h","6h","12h","24h","48h") )

The rest is done by ggplot automatically:

ggplot( pd.m, aes(Time, Gene) ) +
  geom_tile(aes(fill = value)) +
  scale_fill_gradient2(low=muted("blue"), high=muted("red"))

enter image description here

Beasterfield
  • 7,023
  • 2
  • 38
  • 47
3

I don't think ggplot supports this out of the box, but you can use heatmap:

 heatmap(
   as.matrix(dat), Rowv=NA,
   Colv=as.dendrogram(hclust(dist(t(as.matrix(dat)))))
 )

enter image description here

Note this won't look like yours because I'm just using the head of your data, not the whole thing.

Here we specify the clustering manually with a dendogram derived from your hclust with the Colv argument. You can specify the clustering manually too through the Colv argument if the one used by default doesn't line up with what you want.

BrodieG
  • 51,669
  • 9
  • 93
  • 146
1

Thought I'd add you don't need to transform the columns in the data.frame to factors, you can use ggplot's scale_*_discrete function to set the plotting order of axes. Simply set the plotting order using the limits argument and the labels using the labels argument as shown below.

data<-read.table(text="X0      X1      X2       X3       X4       X5       X6        X7        X8        X9
 NM_001001144 6.52334 9.75243 5.62914 6.833650 6.789850 7.421440 8.675330 12.117600 11.551500  7.676900
 NM_001001327 1.89826 3.74708 1.48213 0.590923 2.915120 4.052600 0.758997  3.653680  1.931400  2.487570
 NM_001002267 1.70346 2.72858 2.10879 1.898050 3.063480 4.435810 7.499640  5.038870 11.128700 22.016500
 NM_001003717 6.02279 7.46547 7.39593 7.344080 4.568470 3.347250 2.230450  3.598560  2.470390  4.184450
 NM_001003920 1.06842 1.11961 1.38981 1.054000 0.833823 0.866511 0.795384  0.980946  0.731532  0.949049
 NM_001003953 7.50832 7.13316 4.10741 5.327390 2.311230 1.023050 2.573220  1.883740  3.215150  2.483410", header = TRUE, stringsAsFactors = FALSE)
data <- scale(t(data))
ord <- hclust( dist(data, method = "euclidean"), method = "ward.D" )$order
pd <- as.data.frame( data )
pd$Time <- sub("_.*", "", rownames(pd))
pd.m <- melt( pd, id.vars = "Time", variable.name = "Gene" )
ggplot( pd.m, aes(Time, Gene) ) +
  geom_tile(aes(fill = value)) +
  scale_x_discrete(limits=pd.m$Time[ord], labels = c("0h", "0.25h", "0.5h","1h","2h","3h","6h","12h","24h","48h"))+
  scale_y_discrete(limits=colnames(data), labels = seq_along(colnames(data)))+
  scale_fill_gradient2(low=muted("blue"), high=muted("red"))

enter image description here

Alex Thomas
  • 1,142
  • 1
  • 11
  • 13