1

I can't find a way to get this report to do what I want. My data has this form:

varchar  ClientName
Datetime CallDate
varchar  CallReason

I'm trying to display it in the following fashion ( "|" represent a column in the report):

|          Client 1                    |       Client2                | Client 3         |more client columns
|01/02/14 | client was saying that blah|04/07/14 | printer not working|01/01/14 | testing|
|05/06/14 | keyboard died              |05/07/14 | still not printing |                  |
|08/07/14 | some more complaining      |                              |                  |

What I have right now is kinda the same thing, only every row in the database ends up as a different row in the report, which creates a gigantic report full of empty cells. i get my data from a simple query select * from thetable where CallDate>somefilter

So my actual question would be: how can I group my data in order to have a column group with a details section which doesn't group up with other columns' details.

I want something like : (note: this is random copy-pasted data, actual data does have duplicate dates but not text) enter image description here

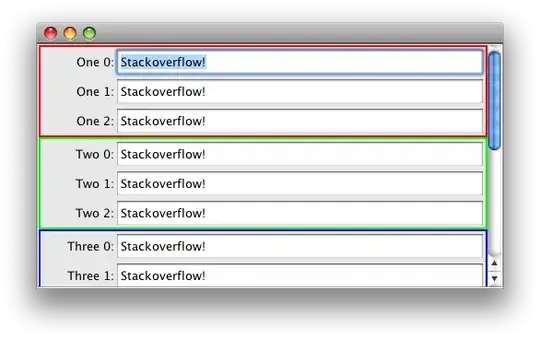
I currently have this (the report goes much further down and right): enter image description here

0xFF
  • 808
  • 1
  • 12
  • 33
  • I may not be clear on your question. Will it work if you return data already group using the SQL Query before you display. Research SQL grouping. Example.. `select ClientName, CallDate, CallReason, count(*) as totalcount from thetable where CallDate > SomeFilter group by ClientName, CallDate, CallReason` or you can use distinct to get distinct info without count `select ClientName, CallDate, CallReason from thetable where CallDate > SomeFilter`. Let me know if I am way out as I was not clear on the question – Tak Aug 18 '14 at 19:55
  • There is no need to group or use distinct. See the added pictures. – 0xFF Aug 18 '14 at 20:06

1 Answers1

2

Here is what I did and I think this is what you require.

Sample data ..

create table soRep1
(
    ClientName varchar(30)
    ,CallDate datetime
    ,CallReason varchar(100)
)

insert into soRep1(ClientName, CallDate, CallReason)
values ('Client 1', '2014-08-01', 'some reason 1')
, ('Client 1', '2014-08-02', 'some reason 2')
, ('Client 1', '2014-08-03', 'some reason 3')
, ('Client 2', '2014-08-02', 'Client 2 some reason 1')
, ('Client 2', '2014-08-04', 'Client 2 some reason 2')
, ('Client 3', '2014-08-01', 'Client 3 some reason 1')
, ('Client 3', '2014-08-03', 'Client 3 some reason 2')

Added dataset to retrieve the data but include Row Number based on Client and Date

In the picture below the query is ..

select ROW_NUMBER() OVER (Partition by ClientName Order by CallDate) as RowNum
    , ClientName, CallDate, CallReason
from soRep1;

Dataset

Add a Matrix object to display and Row Group on RowNum column, Column Group on Client Name.

Report Design

I had to format the date column to display date only. Format property = MM-dd-yyyy

The result is ..

enter image description here

Tak
  • 1,561
  • 1
  • 9
  • 8
  • It works perfectly. Grouping on rownumber per client was a really wise idea. Thank you. – 0xFF Aug 19 '14 at 13:59