1

The other day I was trying to use the famous three-snapshot-technique as described by Addy Osmani in this post. Not that I suspect to have any but as a normal precaution I tend to look for them before launching a new application. I've used this multiple times without any issues.

However, in latest versions of Chrome, it seems the comparison view between heap allocations is no longer possible so you can't see what's retained between them that's causing the leak.

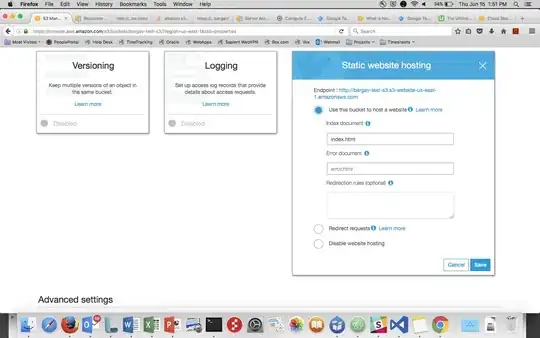
Attaching one screenshot from the quoted article and one screenshot from my machine.

Allocation comparison

enter image description here

No allocation comparison :(

enter image description here

Chrome version is latest stable for Mac which is "36.0.1985.143" at the time of writing. I've also tried Canary and it doesn't work.

Any ideas of what's the approach nowadays with the changed Chrome?

Antonio Laguna
  • 8,973
  • 7
  • 36
  • 72
  • Please check this answer http://stackoverflow.com/questions/11969062/tool-to-track-down-javascript-memory-leak/12061206#12061206 – loislo Aug 18 '14 at 18:58
  • Thanks @loislo but I feel that's incomplete. If I'm not wrong, blue bars appear whenever memory is being allocated since they appear when you interact with the page or something's happening. Also, clicking in the bars seem to create a sort of a wrap around it but I'm not sure what to do here... http://cl.ly/image/2h3G162F1d35 – Antonio Laguna Aug 19 '14 at 12:17
  • This sort of wrap actually is the filter by time. So you can filter out all the objects that were created before or after a particular time. – loislo Aug 24 '14 at 16:51
  • http://youtu.be/ZKzw3VEqifw – loislo Sep 03 '14 at 10:55

1 Answers1

0

You need to select the Take Heap Snapshot checkbox, not Record Heap Allocations. You can then choose Comparison to choose between shapshots to compare.