1

I'm using Python Tools for Visual Studio (PTVS). I can't do the c++ debugging of an extension. I've already enabled native code debugging. My doubt is how to link the 2 projects (c++ and python)? The c++ library is loaded in this way in python (3.4 - 64bit):

cpplib = ctypes.cdll.LoadLibrary(CPPLIB_PATH)

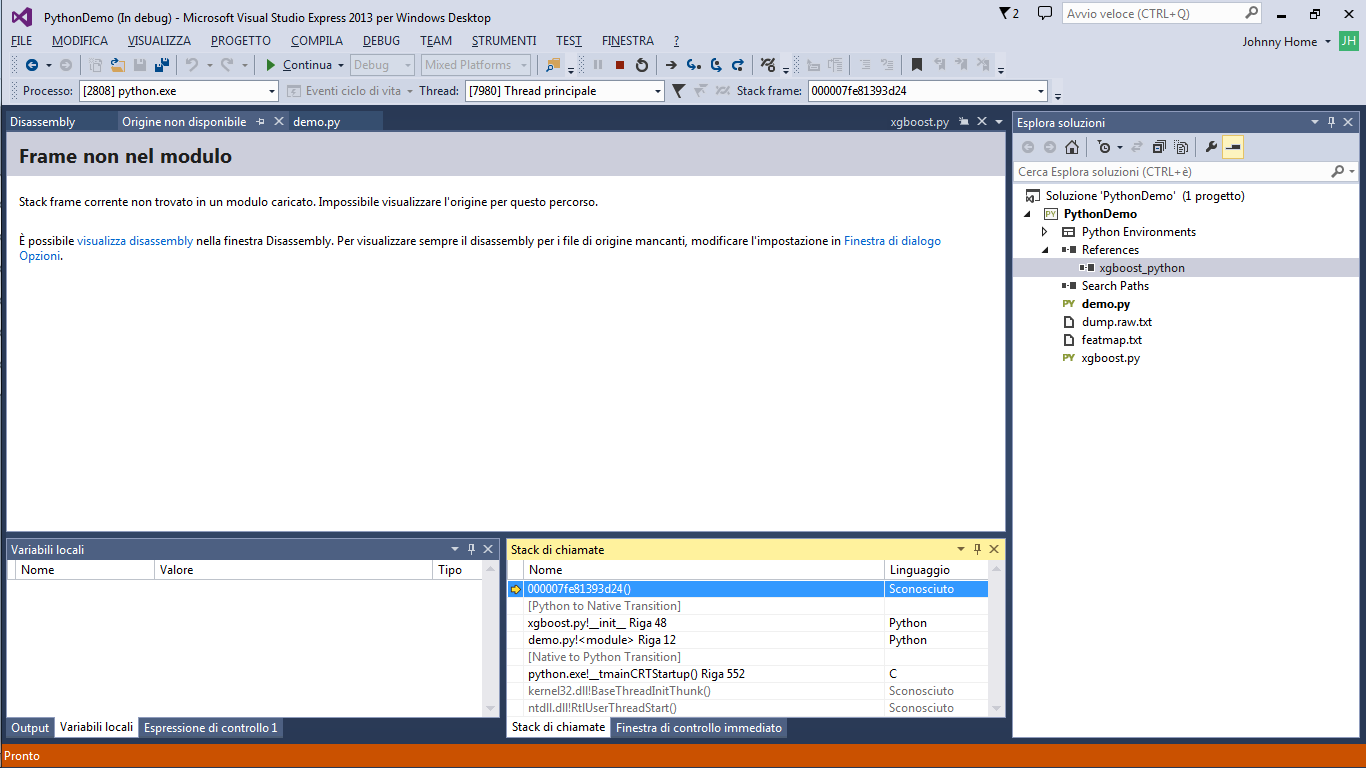
This is what I see from Visual Studio

1 Answers1

1

If you're just using ctypes to load a generic native (non-Python-aware) DLL, then there's no need to do anything special here. The only thing you might want to do is add a project reference from the Python project to the C++ one, so that C++ builds as a dependency when you run the Python app.

The only thing to be aware of is making sure that ctypes can find the DLL at runtime. You might want to set up the C++ project final output path to be alongside your .py files, if you want to refer to the library simply by name.

Pavel Minaev
  • 99,783
  • 25
  • 219
  • 289
  • I added a project reference from the Python project to the C++ one, I've tried for hours :-( I don't know what to do... So you are saying that you have a c++ dll, you load it in python as I've shown in my question and you can debug from visual studio first the calling python code and then the called c++ code, can you? right? Thanks in advance –  Aug 10 '14 at 18:19
  • Yes. It is not entirely clear from the question what kind of problem you're having. Does the DLL not load, or do you have problems hitting breakpoints in C++ code or stepping into it? – Pavel Minaev Aug 10 '14 at 18:21
  • The second thing: the dll loads correctly but I have problems stepping into the c++ code. VS shows disassembler only! I've also referenced the directory with pdb in the symbols setting... But nothing changes... –  Aug 10 '14 at 18:44
  • So you are able to actually step into native code, but C++ source is not loaded for that code? But the Call Stack window does show a frame inside your DLL on the top? If that's the case, you should make sure that the symbols are actually getting loaded. Try opening the Modules window via Debug -> Windows, find your DLL there, and check whether it says "Symbols loaded" or something like that. – Pavel Minaev Aug 10 '14 at 18:48
  • I've pasted a screenshot of my Visual Studio (sorry for the Italian). I think that the c++ dll symbols get not loaded, but I don't know why –  Aug 10 '14 at 19:25
  • This doesn't actually look like a case of unloaded symbols to me. Even without symbols, the frame in the stack should at least include the DLL name (the debugger doesn't need symbols for that, it only needs to know where the DLL is loaded in memory to map the IP to it). This looks more like you're inside some kind of generated code. I believe ctypes actually does generate some thunks to correctly marshal things, but normally they should also show up under ctypes.pyd (and we can then detect and skip them when stepping). This might be something new to Python 3.4 64-bit. – Pavel Minaev Aug 11 '14 at 04:21
  • Can you please file a bug for this in the tracker (https://pytools.codeplex.com/workitem/list/basic)? Unless this is something trivial, I can't promise that it'll get fixed for 2.1, but at least it'll be on the radar for the next release. In the meantime, as a workaround, try to just keep stepping in until you get past the assembly thunk. I suspect it will only take a few steps until you end up in your code. Alternatively, if you know where it is going to end up, set a breakpoint there. – Pavel Minaev Aug 11 '14 at 04:24
  • There is a c++ breakpoint and I've also selected different values for the “Debugger Type” in the project properties. There are many TppWaiterpThreads and I followed the disassembler through the clr.dll jumping the IJWNOADThunk::FindThunkTarget till the CanRunManagedCode, GetThread, UMThunkStub... and finally I was back in Python :-( The issue is tracked [here](http://pytools.codeplex.com/workitem/2588) –  Aug 11 '14 at 09:36
  • It's an old issue that I almost forgot, but I've received your latest comment in the [tracker](http://pytools.codeplex.com/workitem/2588). I've tried now and it is working +1 (can't mark it as answered with the new userid). So the only way is to place an input in the .py and to attach to the process, isn't it? I can't just debug from VS, correct? However, thanks again, I'm able to step into c++ from python now :-) –  Apr 11 '15 at 16:36
  • 1
    When you do "Start Debugging", it's the project system of the startup project that controls which debug engines are used - there's no unified UI for this, everyone does their own thing. So in this case this is the C++ project system, and they have only made provisions for CLR, but not for anything else. – Pavel Minaev Apr 11 '15 at 20:56