i try to debug c++ code in xcode 5.1, in some point i have exception which in visual studio 2012 i used to get massage that tell me to break and then i see call stack ,
but this is not the case in xcode i get the same exception but i can't see the function flow aka the call stack .
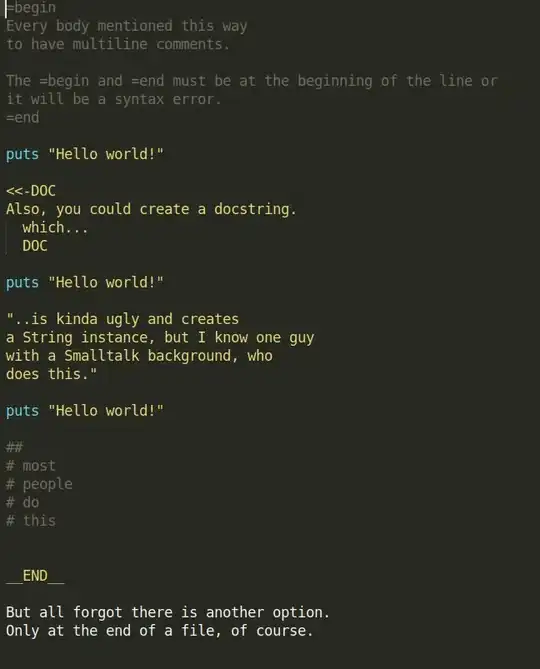
here is what i see in xcode :
Asked
Active
Viewed 309 times
1

user63898
- 29,839
- 85
- 272
- 514
1 Answers
3
In the left panel go down to the bottom and move the slider to the right to expand the entire call stack.

Brian Walker
- 8,658
- 2
- 33
- 35
-
I think they collapse it to show all of the threads and then you can zoom using the slider at the bottom to see more detailed information. – Brian Walker Aug 04 '14 at 19:31
-
ok i found out its not covering all the exceptions , another way it is to add the exception breakpoint, ok i wrong not even the exception break point cover it , im stack with exception that i dont know from where it came ....): – user63898 Aug 04 '14 at 19:44