I coulnd't found any post with a related subject. I actually don't know if its posible.
So I have my. csv file:
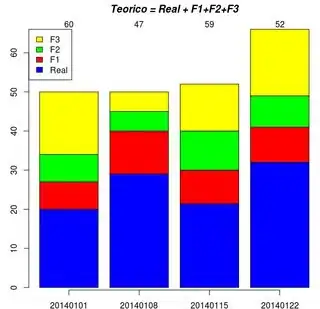
Periodo;Teorico;Real;F1;F2;F3
20140101;50;20;7;7;16
20140108;55;29;11;5;5
20140115;52;21,4;8,6;10;12
20140122;66;32;9;8;17
I asign it to a data.frame:
df<-read.csv2('d:\\xxx\\test2.csv', header = T, sep = ";")
Then I do barplot function:
bp <- barplot(t(df[,-c(1:2)]),col=c("blue", "red", "green", "yellow"),legend=colnames(df[,-c(1:2)]),args.legend = list(x="topleft"))
axis(side = 1, at = bp, labels = df$Periodo)
title(main = "Teorico = Real + F1+F2+F3", font.main = 4)
Now I must calculate the following function: (efficiency function)
((Teorico-Real)/Teorico)*100
And represent the result of the function of each row on the top of each Periodo (week).
If you could help me with the code for the function and "replotting" parts or give some guidelines or posts related to this I would be really gratefull.
Thanks