3

I'm working on a figure consisting of a large number of polar plots in a grid, all of which share a common scale in the radial axis. Each plot needs to be quite small in order to fit into the figure, but when I scale down the dimensions of the axes, the tick labels for the radial axis look crowded and illegible, and obscure the data I'm trying to plot.

For example:

import numpy as np
from matplotlib import pyplot as plt

fig, axes = plt.subplots(1, 4, figsize=(9, 2), subplot_kw=dict(polar=True))

theta = np.r_[np.linspace(0, 2*np.pi, 12), 0]
for aa in axes.flat:
    x = np.random.rand(12)
    aa.plot(theta, np.r_[x, x[0]], '-sb')
    aa.set_rlim(0, 1)

fig.subplots_adjust(left=0.1, right=0.9, bottom=0.1, top=0.9, wspace=0.5)

enter image description here

I realise that the problem can be partly mitigated by reducing the font size and the number of radial ticks, but I'd prefer to avoid having tick labels overlapping with my data altogether. Instead I'd like to have a single 'floating' radial axis that sits outside the plot, something like this:

enter image description here

With a normal Cartesian plot I would just use ax.spine['left'].set_position(...), but a PolarAxesSubplot has only a single u'polar' spine which cannot be offset. Is there a 'nice' way to create a floating radial axis for a polar plot, ideally such that its scale and limits are updated to match any changes to the radial axis of the polar plot itself?

ali_m
  • 71,714
  • 23
  • 223
  • 298
  • [matplotlib polar plot radial axis offset](http://stackoverflow.com/questions/16605137/matplotlib-polar-plot-radial-axis-offset) – mtadd Jun 27 '14 at 17:34
  • 1
    @mtadd No, that's not even remotely what I'm trying to do! Did you even look at the example? – ali_m Jun 27 '14 at 17:35

3 Answers3

3

This is not exactly what you want, but it may give you a hint about how to position the labels exactly for a polar axis:

import numpy as np
from matplotlib import pyplot as plt

fig, axes = plt.subplots(1, 4, figsize=(9, 2), subplot_kw=dict(polar=True))

theta = np.r_[np.linspace(0, 2*np.pi, 12), 0]
for aa in axes.flat:
    x = np.random.rand(12)
    aa.plot(theta, np.r_[x, x[0]], '-sb')
    aa.set_rlim(0, 1)

plt.draw()
ax = axes[-1]
for r, t in zip(ax.yaxis.get_ticklocs(), ax.yaxis.get_ticklabels()):
    ax.text(np.pi/2, r, '$\cdot$'*20 + t.get_text(), ha='left', va='center',
            fontsize=10, color='0.25')
for ax in axes:
    ax.yaxis.set_ticklabels([])

fig.subplots_adjust(left=0.1, right=0.9, bottom=0.1, top=0.9, wspace=0.5)
fig.savefig('test.png', bbox_inches='tight')

enter image description here

Saullo G. P. Castro
  • 56,802
  • 26
  • 179
  • 234
  • 1
    +1 for the very creative abuse of axis `text`! It's a bit of an ugly hack, but it does have the important advantage over @CTZhu's answer that the labels will stay in the correct positions relative to the radial axes of the polar plots when the figure is rescaled. – ali_m Jun 28 '14 at 14:12
2

Maybe we can superimpose another plot on top:

fig, axes = plt.subplots(1, 4, figsize=(9, 2), subplot_kw=dict(polar=True))

for aa in axes.flat:
    aa.plot(theta, r, '-sb')
    aa.set_rlim(0, 1)
    aa.set_yticklabels([])
    
box=axes[0].get_position()
axl=fig.add_axes([box.xmin/2, #put it half way between the edge of the 1st subplot and the left edge of the figure
                  0.5*(box.ymin+box.ymax), #put the origin at the same height of the origin of the polar plots
                  box.width/40, #Doesn't really matter, we will set everything invisible, except the y axis
                  box.height*0.4], #fig.subplots_adjust will not adjust this axis, so we will need to manually set the height to 0.4 (half of 0.9-0.1)
                 axisbg=None) #transparent background.
axl.spines['top'].set_visible(False)
axl.spines['right'].set_visible(False)
axl.spines['bottom'].set_visible(False)
axl.yaxis.set_ticks_position('both')
axl.xaxis.set_ticks_position('none')
axl.set_xticklabels([])
axl.set_ylim(0,1)
axl.set_ylabel('$R$\t', rotation=0)

fig.subplots_adjust(left=0.1, right=0.9, bottom=0.1, top=0.9, wspace=0.5)

enter image description here

Edit

It turn out that the subplots_adjust also affects the superimposing axis. If we check the list of axes inside fig, the superimposing axis is right there (check site-packages\matplotlib\figure.py if you have doubt):

In [27]:

fig.axes
Out[27]:
[<matplotlib.axes.PolarAxesSubplot at 0x9714650>,
 <matplotlib.axes.PolarAxesSubplot at 0x9152730>,
 <matplotlib.axes.PolarAxesSubplot at 0x9195b90>,
 <matplotlib.axes.PolarAxesSubplot at 0x91878b0>,
 <matplotlib.axes.Axes at 0x9705a90>]

The real problem is that the wspace=0.5 not only affects the width of the polar plot, but also affect the height (so the aspect stays the same). But for the non-polar superimposing axis, it only affect the width. Therefore, an additional width modification is required, and the solution is:

fig, axes = plt.subplots(1, 4, figsize=(10, 2), subplot_kw=dict(polar=True))

for aa in axes.flat:
    aa.plot(theta, r, '-sb')
    aa.set_rlim(0, 1)
    aa.set_yticklabels([])

#fig.subplots_adjust(left=0.1, right=0.9, bottom=0.1, top=0.9, wspace=0.5)

box=axes[0].get_position()
axl=fig.add_axes([box.xmin/2, 
                  0.5*(box.ymin+box.ymax),
                  box.width/40,
                  box.height*0.5],
                 axisbg=None)
#fig.add_axes([box.xmin, box.ymin, box.width, box.height])
axl.spines['top'].set_visible(False)
axl.spines['right'].set_visible(False)
axl.spines['bottom'].set_visible(False)
axl.yaxis.set_ticks_position('both')
axl.xaxis.set_ticks_position('none')
axl.set_xticklabels([])
axl.set_ylim(0,1)
axl.set_ylabel('$R$\t', rotation=0)

w_pre_scl=box.width

fig.subplots_adjust(left=0.1, right=0.9, bottom=0.1, top=0.9, wspace=0.5)
ratio=axes[0].get_position().width/w_pre_scl

axlb=axl.get_position()
axl.set_position([axlb.xmin, axlb.ymin, axlb.width, axlb.height*ratio])
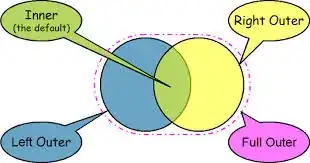
enter image description here

if there is no wspace=0.5, the last few lines has no net affect:

fig.subplots_adjust(left=0.1, right=0.9, bottom=0.1, top=0.9)
#ratio=axes[0].get_position().width/w_pre_scl

#axlb=axl.get_position()
#axl.set_position([axlb.xmin, axlb.ymin, axlb.width, axlb.height*ratio])
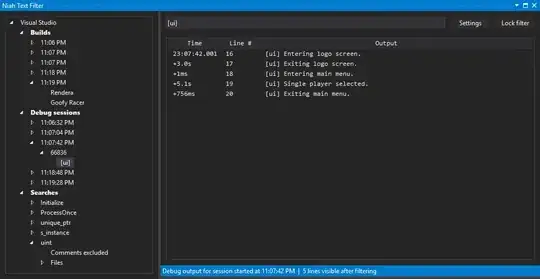
enter image description here

Community
  • 1
  • 1
CT Zhu
  • 52,648
  • 17
  • 120
  • 133
  • True, that looks a lot nicer than Saullo's solution, but as you say it relies on manually setting `box.height`, which breaks as soon as the figure is rescaled. – ali_m Jun 28 '14 at 14:08
  • Perhaps I'm missing something here, but rescaling the height of the figure after plotting still results in a mismatch between the height of the floating axis and the radial axes of the polar plots. Calling the last 3 lines again after rescaling the figure does not correct the mismatch. Likewise, if I change the figure height from 2 to 3 inches before plotting, then again the floating axis no longer matches the radial axes of the polar plots. – ali_m Jun 28 '14 at 16:38
2

Building on Saullo's answer, here's a slightly nicer-looking hack that involves drawing the ticks in data coordinates, then applying a fixed translation in x:

import numpy as np
from matplotlib import pyplot as plt
from matplotlib import transforms

theta = np.linspace(0, 2 * np.pi, 13, endpoint=True)
fig, axes = plt.subplots(1, 4, figsize=(5, 2), subplot_kw=dict(polar=True))

for aa in axes.flat:
    aa.hold(True)
    r = np.random.rand(12)
    r = np.r_[r, r[0]]
    aa.plot(theta, r, '-sb')
    aa.set_rlim(0, 1)
    aa.set_yticklabels([])

factor = 1.1
d = axes[0].get_yticks()[-1] * factor
r_tick_labels = [0] + axes[0].get_yticks()
r_ticks = (np.array(r_tick_labels) ** 2 + d ** 2) ** 0.5
theta_ticks = np.arcsin(d / r_ticks) + np.pi / 2
r_axlabel = (np.mean(r_tick_labels) ** 2 + d ** 2) ** 0.5
theta_axlabel = np.arcsin(d / r_axlabel) + np.pi / 2

# fixed offsets in x
offset_spine = transforms.ScaledTranslation(-100, 0, axes[0].transScale)
offset_ticklabels = transforms.ScaledTranslation(-10, 0, axes[0].transScale)
offset_axlabel = transforms.ScaledTranslation(-40, 0, axes[0].transScale)

# apply these to the data coordinates of the line/ticks
trans_spine = axes[0].transData + offset_spine
trans_ticklabels = trans_spine + offset_ticklabels
trans_axlabel = trans_spine + offset_axlabel

# plot the 'spine'
axes[0].plot(theta_ticks, r_ticks, '-_k', transform=trans_spine,
             clip_on=False)

# plot the 'tick labels'
for ii in xrange(len(r_ticks)):
    axes[0].text(theta_ticks[ii], r_ticks[ii], "%.1f" % r_tick_labels[ii],
                 ha="right", va="center", clip_on=False,
                 transform=trans_ticklabels)

# plot the 'axis label'
axes[0].text(theta_axlabel, r_axlabel, '$r$', fontsize='xx-large',
             ha='right', va='center', clip_on=False, transform=trans_axlabel)

fig.savefig('test.png', bbox_inches='tight')

enter image description here

Again, this has the advantage that the y-positions of the ticks will stay correct relative to the radial axes of the polar plots when the figure size changes. However (before the update from @SaulloCastro), since the x-offset is specified in points, and is fixed, the floating axis will not be positioned correctly when the figure size changes, and can end up overlapping with the polar plot:

enter image description here

ali_m
  • 71,714
  • 23
  • 223
  • 298
  • +1 it is not hard to define the `text` coordinates in order to make it dependent of the radius etc, so that it would be scalable with the figure size... – Saullo G. P. Castro Jun 29 '14 at 14:39
  • @SaulloCastro I've thought about this. Ideally I'd like to set the x-position of the scale bar some fixed number of points to the left of the edge of the axis bounding box. I'm not quite sure how to do this whilst retaining the correct scaling in y. – ali_m Jun 29 '14 at 14:55
  • I've updated your answer including this idea with the `text()` coordinates... now you can rescale the figure in any way that the proportion will be maintained... – Saullo G. P. Castro Jun 29 '14 at 17:08
  • @SaulloCastro Great! I just made one more tweak to position the axis label correctly as well. If I'm really nitpicking, it would still be nicer if the floating axis would stay a fixed number of points away from the edge of the plot rather than a fixed proportion of the radius of the plot, but this might be as good as it gets. – ali_m Jun 29 '14 at 17:25