1

I did some research on this before asking the question and since I might be asking it incorrectly, I might not have done the right searches here first.

What I am trying to accomplish is when I start to debug or run an application in Visual Studio, is to have the IDE show me what methods are executing when I do something in the GUI/application.

For instance if I click a button in the GUI labelled "Search", I want to see the chain of events/methods that execute for this process. This I am not sure of. I hope I have asked the question correctly. Thank you for your time.

abatishchev
  • 98,240
  • 88
  • 296
  • 433
GIZNAJ
  • 501
  • 5
  • 23
  • I'm not sure to understand... are you referring to the callstack? – The_Black_Smurf Jun 23 '14 at 16:22
  • Given that "events/methods" have run times of fractions of a millisecond, how exactly would this be useful? Breakpoints exist to give you a chance to interrupt what usually happens in the blink of an eye. – spender Jun 23 '14 at 16:23
  • You're looking for this. http://stackoverflow.com/questions/44153/can-you-use-reflection-to-find-the-name-of-the-currently-executing-method – jamesSampica Jun 23 '14 at 16:26
  • Thanks for getting back to me. The_Black_Smurf, I'm not sure if that is what I meant, hence the prefix of my question. I wasn't sure if I was asking it correctly or not. – GIZNAJ Jun 23 '14 at 17:01
  • Hi Spender! Thanks for looking at this too! Maybe it is not useful, but maybe I didn't deliver the question properly. I'll respond to the entire thread below. – GIZNAJ Jun 23 '14 at 17:02
  • Thanks Shoe! I'll look into that right away! – GIZNAJ Jun 23 '14 at 17:03
  • I am new to a project that I am testing for. The application is rather large and has lots of components. If I want to test a certain feature, I was wondering if there was a way that I can "turn" something on in VS, so that when I click the button in the GUI, I could see what methods executed. Right now, debugging looks like I have to manually enter in breakpoints and traces. For me being new to the project, that could take a long time. Does that make more sense? – GIZNAJ Jun 23 '14 at 17:06

3 Answers3

1

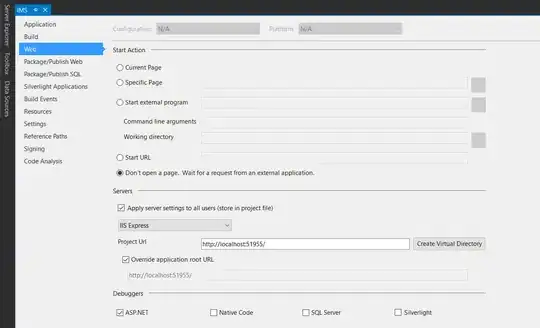
Have a try with IntelliTrace.

  1. Make sure IntelliTrace is enabled and call information is selected; enter image description here
  2. Launch your GUI application, and perform what action you want;
  3. In IntelliTrace window, click Break All. If IntelliTrace window is not displayed, click Debug -> Windows -> IntelliTrace Event;
  4. Expand the event you are interested, for example, 'Clicked Search', and click Call View link; enter image description here
  5. You can see call stack you are interested. enter image description here
qxg
  • 6,955
  • 1
  • 28
  • 36
  • Thanks for the help @qxg. This I can try right now as I'm not able to purchase any of those extensions/add-ons yet. I really appreciate this! (everyone) – GIZNAJ Jun 24 '14 at 12:29
  • Do you know why some projects wouldn't support this feature or not? I am working on a WCF windows form application and I see this when I try and attempt what you have listed: IntelliTrace is not collecting data for process 'iisexpress.exe' The project type may or may not be supported or the process you are debugging may have been eitehr attached to or launched with Intellitrace disabled. Restarting the debugging session within Visual Studio may solve this. – GIZNAJ Jun 24 '14 at 15:52
  • IISExpress is supported. Could you please if IntelliTrace is enabled? – qxg Jun 25 '14 at 12:40
  • I've got it working now. I was wrong in my actions. I was hitting break all after the code finished executing so that won't work. Now I have it showing me the call stack in detail like you mentioned. I'm still having a hard time reading it all, but it is definitely helping out. Thanks again! – GIZNAJ Jun 25 '14 at 16:59
0

There are two ways to approach this:

  1. If you have no idea where the code you are looking for is, then simply start your program with a Profiler such as JetBrains dotTrace. Then, get ready to push the button, click "Start Profiling", click the button, and then as soon as the operation is finished, click "Get Snapshot". Now, use dotTrace's Call Tree to see which methods called which. I use this technique all the time for just this purpose! dotTrace In this view, you can use the arrows key to navigate the method-calls tree.
  2. If you have a general idea of which class[/es] get invoked when you hit the button on the GUI, but don't know exactly which methods are called, you can use OzCode's "Add Breakpoint to Every Method" on a class, so that even if you don't know the exact method that's about to be called, whenever the class is accessed, you'll break into the debugger and be able to explore. Add Breakpoint Every Method

Due Diligence Disclaimer: I am a co-creator of OzCode.

Omer Raviv
  • 11,409
  • 5
  • 43
  • 82
0

You can use the Runtime Flow tool (commercial, developed by me) to see the chain of events/methods in a .NET application for GUI actions.

Sergey Vlasov
  • 26,641
  • 3
  • 64
  • 66