3

I am using this original code posted by Maple expert Acer sometime ago on usenet, which allows one to export an expression to image file.

It works well, but I am not able to figure how to modify it to solve this problem: One has to tell the code the width of the image to produce. I'll be using these images in my latex document. But I do not know before hand the height of the image, since that depends on how large the expression will be. So if I tell it to use width=700, that will produce too much white space above and below the expression.

The expression will be the solution of an ODE. Is there an option one can use to tell Maple to produce an image that fits to the size of the image being exported automatically with no un-needed empty white space around it? At normal resolution?

I think 2 examples will help show the problem. I first run Acer code. This is not set to produce .eps file. change the extension to other gif or jpeg to make other types.

restart:

exportexpression:=proc( ee, filenm::string,
                        {width::posint:=640},
                        {fontsize::posint:=11} )
   uses plots;
   plotsetup('eps','plotoutput'=filenm,
             'plotoptions'=cat("width=",width));
   print(display(textplot([0,0,typeset(ee)],
                          'font'=["times","roman",fontsize]),
                 'axes'='none',
                 'view'=-0.5..0.5,'scaling'='constrained'));
   fclose(filenm):
   plotsetup('default');
   NULL;

end proc:

Then in separate execution cell, I write (the above code needs to be saved first in some folder, so that the image is produces in the same folder)

ode:=diff(y(x),x)+(y(x))^2=a*x+b;  
r:=dsolve(ode,y(x));
fn:=".\\file2.eps";
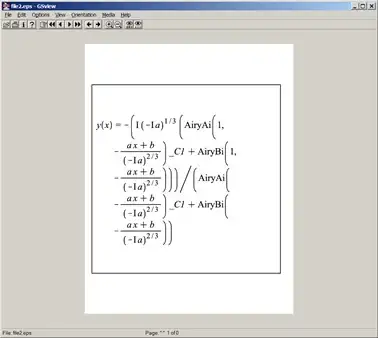
exportexpression( r, fn, width=700, fontsize=12 );

And this produces this image file file2.eps :

Mathematica graphics

You can see how much white space is wasted. changing the code to use width=300 now produces

Mathematica graphics

Which is not what I wanted.

What I really want is to produce eps image using fixed resolution but have it clipped such that there is no wasted white space above or below the image. Called shrink to fit, or such? i.e the eps bounding box should just enclose the expression tight.

I could not even figure how to make it use width=7in, so now it uses pixels. I will later be reading these images to latex and I can scale them later if needed using Latex \includegraphics[scale=] command.

Using Maple 18.01 on windows.

Maple ps plot

Maple plotsetup

Nasser
  • 12,849
  • 6
  • 52
  • 104
  • I don't see how you can figure out how many rows of characters an expression can take up in general (as it may be nested fractions, or have line breaks, etc). I don't recall -- why cannot you run Maple's `latex()` command against your expressions, instead of this involved process that goes through exported images of text plots? – acer Jun 08 '14 at 03:16
  • @acer running Maple latex does not work for many reasons. First, I need to combine output from Maple with other outputs from Mathematica into one latex document. Later I might want to add another outputs. Currently, I do this by manually by copying things and making small images and combine them all into one latex document. With Mathematica, the Export command to eps works well, since the bounding box comes out with the correct size that wraps the expression with no wasted white space. I was hoping to do the same with Maple, then I can write a script to combine all images into one document. – Nasser Jun 08 '14 at 05:21
  • I am trying to see if I can find an external image program that can take the Maple exported image and add/fix the bounding box around the content only, tried Inksscape but did not work. Exporting mathematical expressions to images should not really be that hard in Maple but it is. – Nasser Jun 08 '14 at 05:23

1 Answers1

2

The main problem here is that your eps file has a black border, so cropping software won't work. I suggest outputting a postscript file without a border, then using the system command to call ps2eps to crop the image. In this case the procedure is as follows.

exportexpression:=proc( ee , filenm :: string , { width :: posint := 640 } , 
                                                { fontsize :: posint := 11 } )

   uses plots;

   local f :

   f := cat( filenm , ".ps" ) :

   plotsetup( 'ps' , 'plotoutput' = f , 'plotoptions' = cat( "width = " , width ,
                                                                       ", noborder" ) ) :

   print( display( textplot( [ 0 , 0 , typeset( ee ) ] , 
             'font' = [ "times" , "roman" , fontsize ] ) , 'axes' = 'none' ,
                             'view' = -0.5 .. 0.5 , 'scaling' = 'constrained' ) ) :

   fclose( f ) :

   system( cat( "ps2eps -B -f " , f ) ) :

   plotsetup( 'default' ) :

   return :

end proc :

Note that you should call this using a file name with no extension.

Ian Thompson
  • 156
  • 5