Well, the function itself really does not want to accommodate such a legend. There is no way to pass in any combination of arguments to make it discrete as far as I can tell and all the plotting functions it relies on seem to be locked so you can't really adjust their behavior.
But, the good news is that the function uses grid graphics to make the output. We can hack at the grid objects left on the grid tree to remove the legend they drew and draw our own. I've created a function to do this.
changeLegend<-function(breaks, color) {
    tree <- grid.ls(viewport=T, print=F)
    #find legend
    legendvp <- tail( grep("GRID.VP", tree$name), 1)
    #get rid of grobs in this viewport
    drop <- tree$name[grepl(tree$vpPath[legendvp],tree$vpPath) &
        grepl("grob",tree$type)]
    sapply(drop, grid.remove)

    #calculate size/position of labels
    legend_pos = seq(0,to=1,length.out=length(breaks))
    brat = seq(0,to=1,length.out=length(breaks))
    h = 1/(length(breaks)-1)

    #render legend
    seekViewport(tree$name[legendvp])
    grid.rect(x = 0, y = brat[-length(brat)],
        width = unit(10, "bigpts"), height = h, hjust = 0,
        vjust = 0, gp = gpar(fill = color, col = "#FFFFFF00"))
    grid.text(breaks, x = unit(12, "bigpts"),
        y = legend_pos, hjust = 0,)
}
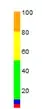
Since they didn't really name any of their viewports, I had to make some guesses about which viewport contained which objects. I'm assuming the legend will always be the last viewport and that it will contain two globs, one for the box of color and one for the text in the legend. I remove those items, and then re-draw a new legend using the breaks and colors passed in. Here's how you would use that function with your sample
library(pheatmap)
library(grid)

mm <- as.matrix(c(1:100))
breaks <- c(1,5,10,50,80,100)
colors <- c("red","blue","green","yellow","orange")

pp<-pheatmap(mm,cluster_rows=FALSE, cluster_cols=FALSE,
   breaks=breaks, color=colors, legend=T)
changeLegend(breaks, colors)
And that produces
Because we are hacking at undocumented grid objects, this might not be the most robust method, but it shows off how flexible grid graphics are