1

I am new in C programming and I have been trying hard to customize an opensource tool written in C according to my organizational needs.

IDE: Eclipse, Debugger: GDB, OS: RHEL

The tool is multi-process in nature (main process executes first time and spawns several child processes using fork() ) and they share values in run time. While debugging in Eclipse (using GDB), I find that the process being debugged is only running while other processes are in suspended mode. Thus, the only running process is not able to do its intended job because the other processes are suspended.

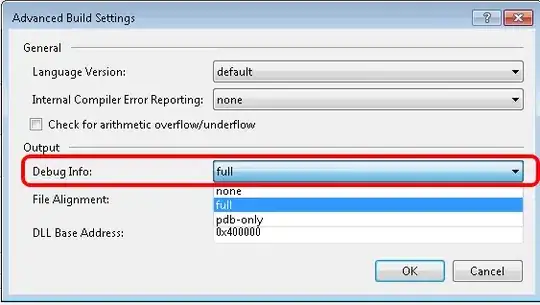
I saw somewhere that using MI command in GDB as "set non-stop on" could make other processes running. I used the same command in the gdbinit file shown below:
debug configuration

Note: I have overridden above .gdbinit file with an another gdbinit because the .gdbinit is not letting me to debug child processes as debugger terminates after the execution of main process.

But unfortunately debugger stops responding after using this command.

Please see below commands I am using in the gdbinit file:
gdbinit file content

Commenting non-stop enables Eclipse to continue usual debugging of the current process.

Adding: You can see in below image that only one process is running while others are suspended.
enter image description here

Can anyone please help me to configure GDB according to my requirement?

Thanks in advance.

Rohit
  • 604
  • 1
  • 10
  • 25
  • Other threads are in suspended mode while thread debugged is also suspended. When you resume debugged thread other threads will also resume. See https://sourceware.org/gdb/onlinedocs/gdb/All_002dStop-Mode.html#All_002dStop-Mode. – dbrank0 May 28 '14 at 13:13
  • @dbrank0: If it is, then I have added an image for you above in the post. That shows that one of the thread is in running mode while others are in suspended mode. Could you please help me more into this. – Rohit May 29 '14 at 07:40
  • Tried it. No special configuration is required. By default, all threads suspend when breakpoint is hit, and all are resumed when resume is selected. Are you sure these threads don't suspend on their own? – dbrank0 May 29 '14 at 08:39
  • I am using MI command in gdbinit file as "set follow-fork-mode child" which automatically makes Eclipse switch to the newly spawned child thread. In this process of switching, threads are left behind in suspended mode. This is all i know. :( – Rohit May 29 '14 at 09:02
  • You use set follow-fork-mode child to set behavior for multiple processes, not threads. It makes little sense for threads. Current thread can be switched at any time anyway. – n. m. could be an AI May 29 '14 at 09:34
  • I could not repriduce this behaviour even with set follow-fork-mode child. Can you test it on a very simple threaded program that never waits for anything in any of the threads? – n. m. could be an AI May 29 '14 at 09:51
  • @n.m. : Well, pardon my little knowledge in system programming. That's why I am still messing with the debugger settings. I have noticed that, fork() has been used to create new processes. So, my mentioning of "threads" above everywhere is incorrect. They are surely processes and that is the reason set follow-fork-mode child is working for me and not for you. I am going to correct the references of thread in my post now. – Rohit May 29 '14 at 09:56
  • The things you see being suspended are threads, not processes, and are called such by the software. If you are using `fork`, you have processes, if you are using functions that have the word "thread" in them, you have threads. If you are not sure, you better stop for a moment and reconsider what you are doing. – n. m. could be an AI May 29 '14 at 10:06

1 Answers1

1

OK @n.m.: Actually, You were right. I should have given more time to understand the flow of the code. The tool creates 3 processes first and then the third process creates 5 threads and keeps on wait() for any child thread to terminate.

Top 5 threads (highlighted in blue) shown in the below image are threads and they are children of Process ID: 17991

enter image description here

enter image description here

The first two processes are intended to initiate basic functionality of the tool and hence they just wait to get exit(0). You can see below.

if (0 != (pid = zbx_fork()))
        exit(0);

    setsid(); 

    signal(SIGHUP, SIG_IGN);

    if (0 != (pid = zbx_fork()))
        exit(0);

That was the reason I was not actually able to step in these 3 processes. Whenever, I tried to do so, the whole main process terminated immediately and consequently leaded to terminate all other processes. So, I learned that I was supposed to "step-into" threads only. And yes, actually I can now debug :)

And this could be achieved because I had to remove the MI command "set follow-fork-mode child". So, I just used the default " .gdbinit" file with enabled "Automatically debug forked process".

Thanks everyone for your input. Stackoverflow is an awesome place to learn and share. :)

Rohit
  • 604
  • 1
  • 10
  • 25