I'm using the heatmap function in Matlab to plot some maps, the maps themselves are fine but the program seems to be adding extra borders and axes onto the figures, no idea why this is happening!
My code is:
  figure(1)
hFig = figure(1);
set(gcf,'PaperPositionMode','auto')
set(hFig,'Position',[1000 1000 900 800])
colormap('hot');
imagesc(data)
xlabel('X({\mu}m)')
ylabel('Y({\mu}m)')
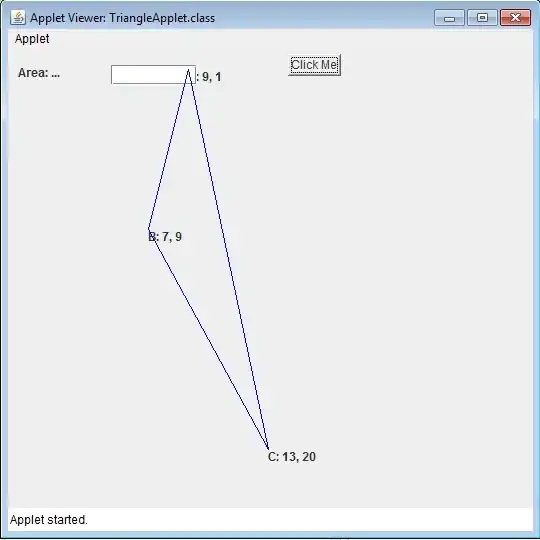
Here is an image of what I mean by extra axes:
Thanks!
Edit1: Here is the image after the first proposed fix: