Here is a possible MATLAB solution.
1) Fake data
To test my code, I first had to generate some fake data resembling your actual one. You can skip this section when working with the real data.
len = 50;

%# random dates inbetween these two
dt_start = datenum('2013-06-22 19:17:00');
dt_end = datenum('2013-06-22 19:23:00');
dt = sort(dt_start + rand(len,1)*(dt_end-dt_start));

%# create the columns
ID = repmat(int32(104885), [len 1]);
Date = cellstr(datestr(dt, 'mm/dd/yyyy'));
Time = cellstr(datestr(dt, 'HH:MM:SS'));
EE = rand(len,1);

%# combine columns into a cell array
C = [num2cell(ID), Date, Time, num2cell(EE)];

%# create a "table" for convenience, and export to CSV file
t = cell2table(C, 'VariableNames',{'ID', 'Date', 'Time', 'EE'})
writetable(t, 'data.csv')

%# cleanup
clear len dt_start dt_end dt ID Date Time EE C t
Here is an extract of the data I generated for this example:
t =
      ID          Date           Time          EE
    ______    ____________    __________    _________
    104885    '06/22/2013'    '19:17:19'      0.95808
    104885    '06/22/2013'    '19:17:22'      0.72305
    104885    '06/22/2013'    '19:17:31'      0.86481
    104885    '06/22/2013'    '19:17:33'      0.52325
    .
    .
    104885    '06/22/2013'    '19:22:37'       0.5167
    104885    '06/22/2013'    '19:22:39'      0.53815
    104885    '06/22/2013'    '19:22:41'      0.27151
    104885    '06/22/2013'    '19:22:54'      0.37826
    104885    '06/22/2013'    '19:22:59'      0.51215
2) Frequency count in time intervals
I read the data from CSV file, then apply a process similarly to what was used in the post you linked to. In this case, the time interval length is a parameter you can specify (10 minutes interval, 1 hour, etc..)
%# load data from CSV
t = readtable('data.csv', 'Format','%d %s %s %f', 'Delimiter',',', ...
    'ReadVariableNames',true, 'FileType','text');

%# convert date/time columns to serial date number
dt = datenum(strcat(t.Date , {' '}, t.Time), 'mm/dd/yyyy HH:MM:SS');

%# desired interval window-size (expressed in units of days).
%# Here I am using a 2 minutes interval
interval = 2/(24*60);    % (24 hours per day, 60 min per hour)

% bin datetimes into specified intervals
dt_binned = fix(dt/interval)*interval;

% count frequencies in each interval
[dt_unique,~,dt_unique_idx] = unique(dt_binned);
counts = accumarray(dt_unique_idx, 1);
freq = [cellstr(datestr(dt_unique)) num2cell(counts)]
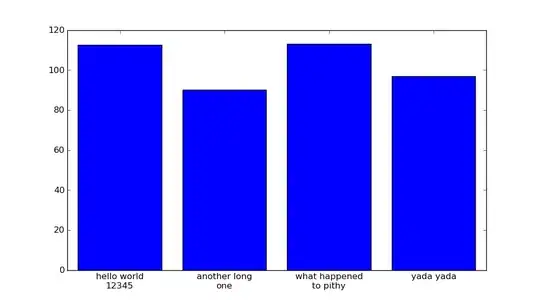
The result:
freq =
    '22-Jun-2013 19:16:00'    [ 7]
    '22-Jun-2013 19:18:00'    [21]
    '22-Jun-2013 19:20:00'    [12]
    '22-Jun-2013 19:22:00'    [10]
So we had 7 events occurred in the first interval (from 19:16 to 19:18), 21 events in the second event, and so on. You can easily adapt the code to change the interval length.