I guess a start would be
FIS <- newFIS("daytest")
FIS <- addVar(FIS, "input", "daytime", 0:2400)
FIS <- addMF(FIS, "input", 1, triMF("Midnight", 0:2400, c(0,0,600,1)))
FIS <- addMF(FIS, "input", 1, triMF("Morning", 0:2400, c(0,600,1200,1)))
FIS <- addMF(FIS, "input", 1, triMF("Noon", 0:2400, c(600,1200,1800,1)))
FIS <- addMF(FIS, "input", 1, triMF("Evening", 0:2400, c(1200,1800,2400,1)))
FIS <- addMF(FIS, "input", 1, triMF("Mignight", 0:2400, c(1800,2400,2400,1)))


class(FIS)
plotMF(FIS, "input",1)
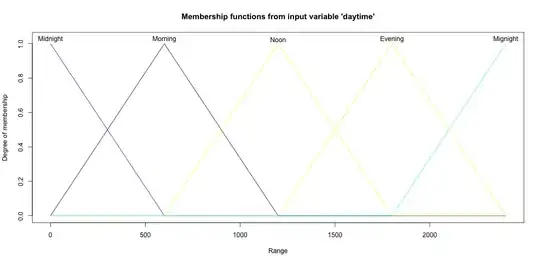
The problem is that the documentation doesn't say anything explicitly about cyclic models, so it may be unlikely that it knows to wrap time around such that both midnights are the same. but by taking a peek at the object, it looks like you can somewwhat easily manipulate it such that you can make any shape you want. So i tried this
FIS$inputList[[1]]$membershipFunctionList[[1]]$mfVals <-
    FIS$inputList[[1]]$membershipFunctionList[[1]]$mfVals+
    FIS$inputList[[1]]$membershipFunctionList[[5]]$mfVals
FIS$inputList[[1]]$membershipFunctionList[[1]]$mfType <- "wrapmf"
FIS$inputList[[1]]$membershipFunctionList[[5]]<-NULL
Here I manually combined the two midnight values, changed the "type" so it doesn't accidentally try to reset it at any point or make any wrong assumptions based on the fact it thinks it's triangular, and then removed the second midnight category. Not it produces this plot

You can see that the first and last peaks are now both red (and there is no separate label for the second one). Based on the limited amount i've read, that should work.