52

I am trying to get xdebug working with eclipse (3.5) / php (on xampp windows 7). I have verified xdebug is enabled in php - I have the fancy output and my phpinfo shows all the xdebug stuff. I have remote debug on, and typed in the lan ip address on my eclipse machine.

When I tell eclipse to debug, it launches the browser and passes the debug URL parameters. That looks OK.

However, in eclipse debug perspective it shows 'launching myproject' 57% 'waiting for xdebug session'. It sits there forever.

I have turned off windows firewall on both machines.

I tried turning implicit flush on.

Any ideas?
Scott Szretter
  • 3,938
  • 11
  • 57
  • 76
  • 1
    I feel a little stupid, but several hours later I figured out my problem was the comment `";"` at the beginning of this line: zend_extension="/blah/blah" I know is not an error or similar, but, maybe this can help. – Giuseppe Urso Dec 19 '12 at 14:26
  • 1
    One of the problems I was struggling with even after doing all these steps is highlighted in the following link..set xdebug.remote_connect_back = 0 http://stackoverflow.com/questions/9388245/php-debug-configuration-hangs-waiting-for-xdebug-session-57 – user672365 Apr 27 '14 at 14:27

27 Answers27

63

I had this problem too and I was missing this line in the php.ini file:

xdebug.remote_enable = On
David Ferenczy Rogožan
  • 23,966
  • 9
  • 79
  • 68
Goran
  • 1,807
  • 7
  • 27
  • 41
  • 6
    +1, I needed to do the same to get xdebug working with eclipse after installing xdebug on ubuntu using `apt-get install php5-xdebug`. – marcvangend Nov 21 '10 at 20:43
  • 9
    I also have this issue, it is stopped at 57% waiting for xdebug session, I've verified that xdebug.remote_enabled = On, and as per another discussion, i turned output buffering off. it is still not working :( I can't stand working without a debugger, it's painful. – stephenbayer Jan 14 '11 at 15:56
  • 1
    If you have xdebug version 2.2.6 (or newer I assume) make sure you remove double quotes in xdebug.ini eg: xdebug.remote_host=localhost not xdebug.remote_host="localhost". Same with zend_extension, remote_handler and probably others – MartinM Dec 31 '14 at 22:33
  • 1
    This line was not required for me in PHP 5.2 through PHP 5.4.. but when I upgraded to PHP 5.6 it broke, this answer fixed it! – Professor Falken Oct 23 '15 at 00:49
14

Make sure you defined zend_extention with ABSOLUTE path in the php.ini:

e.g.: zend_extension=D:\SANDBOX\server\php\php_xdebug-2.1.0-5.3-vc6.dll

I'm debugging a local project on Windows. So far I did not need xdebug.remote_enable = On.

Suggestions if the Xdebug session does not start (hangs at 57 %), make sure that:

  • zend_extention directive is set with absolute path and the debug is loaded, use phpinfo() to check
  • firewall does not block the default 9000 port or Eclipse.
  • another application is not using the port (execute: netstat -an |find /i "listening" from the command line)

If you need to setup a different port use in php.ini:

xdebug.remote_enable = on
xdebug.remote_port = XXXX 

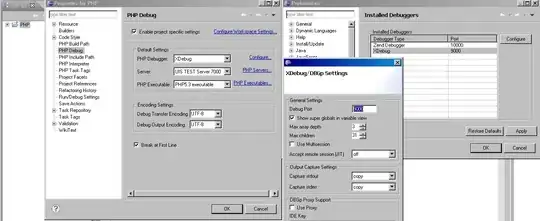
and correct the Xdebug settings in Eclipse:

XDEBUG settings in Eclipse

David Ferenczy Rogožan
  • 23,966
  • 9
  • 79
  • 68
uicoded
  • 617
  • 1
  • 9
  • 15
  • 1
    "give me reputation and I can upload screenshots." Upvoted you, but you could also post it to imgur and link. I am in need of these images; can't figure out how to change the port. – EricP Mar 20 '11 at 21:39
  • 2
    Found it. It's in Window->Preferences->PHP->Debug->InstalledDebuggers. Something else was using port 9000. – EricP Mar 20 '11 at 21:44
  • 1
    Thank you so much. The example you have provided exactly fixed my problem. – Sukeshini Sep 06 '13 at 14:02
  • 1
    I had a project that was not even a PHP project and aptana was often blocking port 9001. I went into Apatana > preferences and searched for debug, and under php it was certainly using port 9001. I changed this and haven't had a problem since. Thanks for the tip. – Senica Gonzalez Oct 09 '13 at 18:27
9

I had the same problem and I fixed it by changing the port to XDebug (now using port 9001).

Here is my php.ini content:

zend_extension ="C:\...\EasyPHP-5.3.3\php\ext\php_xdebug-2.dll"
xdebug.remote_enable=1
xdebug.remote_host=localhost
xdebug.remote_port=9001
xdebug.remote_handler=dbgp
xdebug.profiler_enable=0
xdebug.remote_mode=req
xdebug.remote_autostart=0

Also check the apache log file and make sure that you don't have the following Warning message:

PHP Warning: Xdebug MUST be loaded as a Zend extension in Unknown on line 0
Warning: Xdebug MUST be loaded as a Zend extension in Unknown on line 0

If you do, open the php.ini file and comment with a ';' the extension=php_xdebug-2.dll line:

;extension=php_xmlrpc.dll
extension=php_xsl.dll
**;extension=php_xdebug-2.dll**
;/PHPExt
Michiel
  • 7,855
  • 16
  • 61
  • 113
marco
  • 91
  • 1
  • 1
7

After fighting for 3 hours and trying out every solution on forums, I found out that the simple trick was to remove the quotes while specifying the path of the Xdebug dll in zend_extension in php.ini. I am using XAMPP (PHP 5.3.6 + Apache 2.2)+ Eclipse Indigo + PDT + Xdebug 2.1.2 on Windows Vista.

Here is the exact configuration that worked for me -

zend_extension=C:\xampp\php\ext\php_xdebug-2.1.2-5.3-vc6.dll
#Note that the path above is not in quotes
xdebug.remote_enable=true
xdebug.remote_host=localhost
xdebug.remote_port=9001
xdebug.remote_handler=dbgp
xdebug.profiler_enable=1
xdebug.profiler_output_dir=C:\xampp\tmp

I have used port 9001 so that it does not clash with 9000 in case that's already used by another program. Make sure this matches the port in Eclipse > Preferences > PHP > Debug > Xdebug too. Also, restart apache after editing php.ini.

Once I added this to php.ini, everything worked like ice cream.

cloudwhale
  • 524
  • 5
  • 4
6

I had the same problem with Zend Studio. I have noticed that the xdebug session was not starting properly. I passed this string to the url once and it worked since then.

http://localhost/myalias/?XDEBUG_SESSION_START=ECLIPSE_DBGP&KEY=13750956767461

I'm sure it's a matter of configuration somewhere in the IDE.

Artur Kedzior
  • 3,994
  • 1
  • 36
  • 58
  • 1
    I've been fighting this issue and trying everything I could find on a new dev environment setup. This simple post got it working for me. Litteraly a copy/paste from this post triggered a breakpoint. And from there simply hitting http://locahost worked as expected. Thanks! – Aaryn Oct 31 '13 at 01:21
  • 1
    Worked for me too. Can anyone explain what that weird "KEY" value is? The same value seems to work for everybody, which is strange... – pgr Nov 22 '15 at 20:05
  • And it also worked for me, when I set a breakpoint in Eclipse and enter this URL in the browser, without telling Eclipse to run or debug. So how do we configure PHP to do this? Mine was using `http://localhost/myalias/?XDEBUG_SESSION_STOP_NO_EXEC=ECLIPSE_DBGP&KEY=14748086750741` – Mawg says reinstate Monica Sep 25 '16 at 13:09
  • 1
    @pgr I found this page https://www.eclipse.org/forums/index.php/t/16234/ which says `Is the "KEY=xxxx" argument really needed, and if so, how is it used? The key is used to get around an issue with Internet Explorer where is caches the page based on the URL. Eclipse would use IE as the internal web browser and without using something that changed the URL you saw the same results being displayed even though you had changed the script.` – Mawg says reinstate Monica Sep 25 '16 at 13:37
3

I realized that TCP port was in use and that was the reason why it was hanging. I changed port in php.ini and eclipse settings.

Velja Radenkovic
  • 716
  • 1
  • 6
  • 27
2

Check that Eclipse's web browser settings are correct.

Window/Preferences/General/Web Browser/external Web Browsers/Edit settings

In my case, the path to the external web browser binary was incorrect. It said "/usr/bin/mozilla" instead of "/usr/bin/firefox". Don't know how this setting came about, but after changing it the firefox browser window came up at last.

knb
  • 9,138
  • 4
  • 58
  • 85
1

I looked into apache log and there were many lines with file not found error.

Run -> Debug configurations -> PHP web page -> Your_configuration

I unchecked auto generate and set filename to index.php.

It seems that in case of any mistake that prevents eclipse from normal functioning causes this "waiting for session"

Jens Wirth
  • 17,110
  • 4
  • 30
  • 33
Mir
  • 11
  • 1
  • 1
    Upvote for suggesting looking at the Apache logs. This should be the first thing to check, even before looking at the Eclipse configuration (it didn't help me to solve my version of this problem, but it reminded me to be methodical) – Mawg says reinstate Monica Sep 25 '16 at 12:57
1

I had the exact same problem. My configs were par with yours and in addition to having xdebug.remote_enable = On in the php.ini file also adding the following:

xdebug.remote_connect_back=1

this enables multihost remote debugging, as an alternative you can define the host IP.

xdebug.remote_host=IP_ADDRESS
Ryan Litwiller
  • 497
  • 5
  • 24
1

For me, adding the [xdebug] configurations suggested by others to a php.ini file kept in following path C:\wamp64\bin\apache\apache2.4.23\bin helped. Essentially it's a symbolic link that points/links to phpForApache.ini file under your respective php version folder that gets installed with wamp64 e.g. php5.6.25.

In nutshell, adding following lines phpForApache.ini to helped me -

    zend_extension = c:\wamp64\bin\php\php5.6.25\ext\php_xdebug-2.5.1-5.6-vc11-x86_64.dll
    xdebug.remote_enable=On
    xdebug.remote_host="localhost"
    xdebug.remote_port=9000
    xdebug.remote_handler="dbgp"

Hope this helps

1

Xdebug 3 has changed the php.ini options (see https://xdebug.org/docs/upgrade_guide), and the default IP address has changed from 9000 to 9003.

As of PHP 8.2.6 and Xdebug 3.2.1 the following option enables xdebug:

xdebug.mode=debug

The port can be changed with:

xdebug.client_port=9010
Eborbob
  • 1,905
  • 1
  • 15
  • 30
0
  1. The above inputs were useful. I checked xdebug parameter values in phpInfo() and found that despite my settings to 1 or On, auto_trace and remote_enable were off. So i made it to true. And then remote worked!. Thanks.
  2. Note, now you can launch the remote debugging session from within Eclipse by configuring various Debug configurations OR/and whenever you launch your such configured application outside Eclipse, you will get a question at Eclipse to accept or not to accept the debug session. So if you are on a different machine than of the eclipse UI you might find that the call to your application is getting timed out for no reason. Actually there would be a yes - no dialog box wherever the Eclipse session is
nitish
  • 21
  • 2
0

If Netweaver/Eclipse fails to connect to XDebug, you may wish to check the Apache logs for occurrences of something like: Cannot load Xdebug - it was built with configuration API220090626,TS,VC6, whereas running engine is API220090626,TS,VC9 [Fri Jun 01 18:38:05 2012] [notice] Child 3404: Child process is running

To remedy this, pick the right version of the XDebug binary from the XDebug website (try a few combinations till you get it working)

user
  • 86,916
  • 18
  • 197
  • 190
0

This thread helped me sort out my issue with MAMP on OSX with Eclipse. After upgrading to MAMP 2.1.1 from the 1.x release, I was not able to get xdebug to work in eclipse. It was hanging at the 57% level.

phpinfo showed that xdebug extension was loading fine and there were no errors in the PHP or Apache logs.

I only wanted to debug locally but the reason for the issue was that remote debugging was not enabled. Adding xdebug.remote_enable=true to the MAMP PHP.ini template and restarting MAMP solved the issue.

blainelang
  • 91
  • 1
  • 3
0

In my case CLI application was working fine, but it was the web application which was getting stuck at 57%.

It worked after 2 changes:

  1. made server debugger as XDebug
  2. Auto Generate URL true.
Mihai Iorga
  • 39,330
  • 16
  • 106
  • 107
0

Before eclipse setting, Check out the following content is visible in phpinfo function.

This program makes use of the Zend Scripting Language Engine: Zend Engine v2.4.0, Copyright (c) 1998-2013 Zend Technologies with Xdebug v2.2.3, Copyright (c) 2002-2013, by Derick Rethans

0

I too encountered the same problem. I double checked all the settings in php with the output of phpinfo() and everything was fine.

Allowing Java(TM) Platform SE binary through the firewall did the trick.

Check out the commands from this question, they are very useful for debugging!

Community
  • 1
  • 1
Daniel Iancu
  • 435
  • 1
  • 5
  • 12
0

Yeah, check network/port stats. In my case I'm using vmware fusion on mac, and the process vmware-natd was hogging the cpu (blocking on an open port I'm assuming), which I didn't notice. php.ini was completely fine, had to run this to get it to work again:

sudo "/Library/Application Support/VMware Fusion/boot.sh" --restart

So ppl check your php.ini (or xdebug.ini) file first. If it looks ok ala this discussion, then check that you're not having networking issues.

Community
  • 1
  • 1
lefnire
  • 2,524
  • 2
  • 26
  • 36
0

I've tried every possible solution on this post to get xdebug to work on a site running on Apache (http port 8000) to no avail. I then accidentally noticed that xdebug was working on another site that I had running on port 80. As soon as I changed the other site to port 80, it finally allowed me to debug it.

I wonder if there's a setting that can direct Apache to allow xdebug on other ports than just 80. I have more than one site running in Apache and would like to debug each of them without having to reconfigure the ports. Anyone had this issue before? or knows how to fix it?

MaxRelax
  • 31
  • 2
0

If your configuration is ok, just delete the file : YOUR_WORKSPACE/.metadata/.plugins/org.eclipse.core.resources/.root/.markers

Ripper
  • 49
  • 2
0

I don't know this means to you anymore or not! But, did you hit to a PHP file (anything.php) with right debug parameter, something like XDEBUG_SESSION_START=ECLIPSE_DBGP&KEY=12882809194391.

People often make mistakes to hit a HTML file with the debug parameters which causes Eclipse to hang at xdebug session

Abdul Munim
  • 18,869
  • 8
  • 52
  • 61
0

Had same issue using Uniserver Zero XIII 13.2.0 (requires MS VC12 redistributable install) and Eclipse Neon Release Candidate 3(4.6.ORC3). Our website uses phalcon, when we found an issue with the phalcon.dll and php7.0 we dropped back to php5.6. We verified xdebug settings above, added zend_extension=$(US_ROOTF)/php56/extensions/php_xdebug.dll--would not connect, no break points.

Found a warning at top of Eclipse Dialog Project | Properties | PHP | Debug | Configure Workspace Settings... | PHP Executables | PHP56(Workspace Default) | Edit | Debugger | "XDebug extension is not installed. Please visit http://xdebug.org...". This made us suspicious of the version of the php_xdebug.dll (2.5.0) in the Uniserver 13.2.0 php56. I downloaded php_xdebug-2.4.1-vc11.dll, dropped it in /php56/extensions and PRESTO! Eclipse PHP Debugger works!

0

I had a similar problem and it turned out I was using the wrong dll. Hope that helps someone in the future.

Scott Warren
  • 1,581
  • 1
  • 17
  • 30
0

I had the same symptom. However, my problem was that I set xdebug.remote_host = "" I did this because I'm using apache virtual hosts to eliminate the need for localhost. However, I had change it back to xdebug.remote_host = "localhost" and then change my apache/etc/hpppd-vhosts.conf to have localhost point to my root c:\web.

0

For me, these symptoms were caused by the windows firewall (Win7 Pro). I needed to explicitly allow eclipse to pass the firewall. I did this via the dialog at "Control Panel\All Control Panel Items\Windows Firewall\Allowed Programs".

Seth Battin
  • 2,811
  • 22
  • 36
0

It might not be useful to everybody, but... when trying to debug remote hosts, always remember the DSL router! (or any router along the way) I spent hours trying to find a solution, when I noticed that all I had to do was to activate port forwarding (port 9000) on my Linksys and everything worked like a charm :)

Duccio
  • 143
  • 2
  • 7
-1

Here is another blog which mentions how to verify if Xdebug is properly installed or not via the command line http://allcodeverything.blogspot.com/2012/07/code-debugging-with-xdebug-and-eclipse.html

It mentions this If you want to figure out if everything worked well, here is a nice piece of code that you'll run through the CLI (command-line interpreter, basically outside of Apache or a browser; just pure PHP) after you have typed the following in your browser: "http://localhost/dbgtest.php?XDEBUG_SESSION_START=ceable"

<?php
$address = "localhost";
$xdebug_port = 9000;
$sock = socket_create(AF_INET, SOCK_STREAM, 0);
socket_bind($sock, $address, $xdebug_port) or die('Unable to bind');
socket_listen($sock);
$debug_client = socket_accept($sock);
echo "connection established: $debug_client";
socket_close($debug_client);
socket_close($sock);
?>

The command-line window should print something like "connection established: Resource id #5".

pal4life
  • 3,210
  • 5
  • 36
  • 57