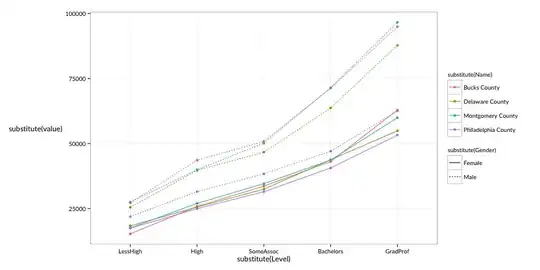
I have taken example from http://www.ling.upenn.edu/~joseff/rstudy/plots/graphics/phila_bar.R and a command from http://www.ling.upenn.edu/~joseff/rstudy/summer2010_ggplot2_intro.html (search for Gender:Name on this page) . I tried to put the command inside a function and tried calling the function without quotes around variable names, but it is not working despite using substitute(deparse...:
phil <- structure(list(Name = structure(c(1L, 1L, 1L, 1L, 1L, 1L, 1L,
1L, 1L, 1L, 2L, 2L, 2L, 2L, 2L, 2L, 2L, 2L, 2L, 2L, 3L, 3L, 3L,
3L, 3L, 3L, 3L, 3L, 3L, 3L, 4L, 4L, 4L, 4L, 4L, 4L, 4L, 4L, 4L,
4L), .Label = c("Bucks County", "Delaware County", "Montgomery County",
"Philadelphia County"), class = "factor"), Gender = structure(c(1L,
1L, 1L, 1L, 1L, 2L, 2L, 2L, 2L, 2L, 1L, 1L, 1L, 1L, 1L, 2L, 2L,
2L, 2L, 2L, 1L, 1L, 1L, 1L, 1L, 2L, 2L, 2L, 2L, 2L, 1L, 1L, 1L,
1L, 1L, 2L, 2L, 2L, 2L, 2L), .Label = c("Female", "Male"), class = "factor"),
    value = c(15288L, 43054L, 25788L, 62853L, 33622L, 50792L,
    27184L, 71321L, 43593L, 94877L, 32442L, 54872L, 43751L, 18346L,
    25545L, 87732L, 46656L, 63640L, 39675L, 25468L, 43636L, 34558L,
    59923L, 26979L, 17550L, 27492L, 71404L, 39946L, 50107L, 96580L,
    24957L, 17433L, 31468L, 40585L, 53239L, 21899L, 62542L, 38352L,
    47008L, 31485L), Level = structure(c(1L, 4L, 2L, 5L, 3L,
    3L, 1L, 4L, 2L, 5L, 3L, 5L, 4L, 1L, 2L, 5L, 3L, 4L, 2L, 1L,
    4L, 3L, 5L, 2L, 1L, 1L, 4L, 2L, 3L, 5L, 2L, 1L, 3L, 4L, 5L,
    1L, 5L, 3L, 4L, 2L), .Label = c("LessHigh", "High", "SomeAssoc",
    "Bachelors", "GradProf"), class = "factor")), .Names = c("Name",
"Gender", "value", "Level"), class = "data.frame", row.names = c(3463L,
3465L, 3466L, 3467L, 3468L, 3471L, 3473L, 3475L, 3478L, 3479L,
8741L, 8742L, 8743L, 8746L, 8750L, 8751L, 8752L, 8754L, 8756L,
8757L, 22925L, 22926L, 22927L, 22928L, 22929L, 22933L, 22937L,
22938L, 22939L, 22940L, 25844L, 25845L, 25846L, 25847L, 25849L,
25854L, 25855L, 25856L, 25858L, 25860L))


testfn = function(gdf, Level, value, Gender, Name){
    print(
    ggplot(gdf, aes(deparse(substitute(Level)), deparse(substitute(value)),
         color = deparse(substitute(Name)),
         linetype = deparse(substitute(Gender)),
         group = deparse(substitute(Gender)):deparse(substitute(Name))))+
       geom_point()+
       geom_line()
    )
}

testfn(phil, Level, value, Gender, Name)
Error in deparse(substitute(Gender)):deparse(substitute(Name)) :
  NA/NaN argument
In addition: Warning messages:
1: In deparse(substitute(Gender)):deparse(substitute(Name)) :
  numerical expression has 4 elements: only the first used
2: In deparse(substitute(Gender)):deparse(substitute(Name)) :
  numerical expression has 5 elements: only the first used
3: In eval(expr, envir, enclos) : NAs introduced by coercion
4: In eval(expr, envir, enclos) : NAs introduced by coercion
5: In deparse(substitute(Gender)):deparse(substitute(Name)) :
  numerical expression has 4 elements: only the first used
6: In deparse(substitute(Gender)):deparse(substitute(Name)) :
  numerical expression has 5 elements: only the first used
7: In eval(expr, envir, enclos) : NAs introduced by coercion
8: In eval(expr, envir, enclos) : NAs introduced by coercion
>
Where could be the problem. Thanks for your help.