1

I am stuck in a rather complicated situation. I am plotting some data as an image with imshow(). Unfortunately my script is long and a little messy, so it is difficult to make a working example, but I am showing the key steps. This is how I get the data for my image from a bigger array, written in a file:

data = np.tril(np.loadtxt('IC-heatmap-20K.mtx'), 1)
#
#Here goes lot's of other stuff, where I define start and end
#
chrdata = data[start:end, start:end]
chrdata = ndimage.rotate(chrdata, 45, order=0, reshape=True, 
                         prefilter=False, cval=0)
ax1 = host_subplot(111) 
#I don't really need host_subplot() in this case, I could use something more common;
#It is just divider.append_axes("bottom", ...) is really convenient.
plt.imshow(chrdata, origin='lower', interpolation='none',
           extent=[0, length*resolution, 0, length*resolution]) #resolution=20000

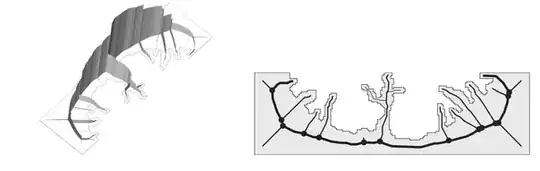
So the values I am interested in are all in a triangle with the top angle in the middle of the top side of a square. At the same time I plot some data (lot's of coloured lines in this case) along with the image near it's bottom. with extent without aspect

So at first this looks OK, but is actually is not: all pixels in the image are not square, but elongated with their height being bigger, than their width. This is how they look if I zoom in: pixels with extent without aspect

This doesn't happen, If I don't set extent when calling imshow(), but I need it so that coordinates in the image and other plots (coloured lines at the bottom in this case), where identical (see Converting coordinates of a picture in matplotlib?). I tried to fix it using aspect. I tried to do that and it fixed the pixels' shape, but I got a really weird picture: extent and aspect

The thing is, later in the code I explicitly set this:

ax1.set_ylim(0*resolution, length*resolution) #resolution=20000

But after setting aspect I get absolutely different y limits. And the worst thing: ax1 is now wider, than axes of another plot at the bottom, so that their coordinates do not match anymore! I add it in this way:

axPlotx = divider.append_axes("bottom", size=0.1, pad=0, sharex=ax1)

I would really appreciate help with getting it fixed: square pixels, identical coordinates in two (or more, in other cases) plots. As I see it, the axes of the image need to become wider (as aspect does), the ylims should apply and the width of the second axes should be identical to the image's. Thanks for reading this probably unclear explanation, please, let me know, if I should clarify anything.

UPDATE

As suggested in the comments, I tried to use

ax1.set(adjustable='box-forced')

And it did help with the image itself, but it caused two axes to get separated by white space. Is there any way to keep them close to each other?

extent, aspect and box-forced

Community
  • 1
  • 1
Phlya
  • 5,726
  • 4
  • 35
  • 54
  • see http://stackoverflow.com/questions/14907062/matplotlib-aspect-ratio-in-subplots-with-various-y-axes/14911939#14911939 The problem is that you are over constraining the axes limits due to using both aspect=1 and linking it to another axes. – tacaswell Apr 29 '14 at 12:57
  • @tcaswell, I am sorry, I don't quite understand to which part of that answer you refer. And yes, I do both set specific aspect and link it to another axes, but that's what I need to do... – Phlya Apr 29 '14 at 13:06
  • The adjustable kwarg. – tacaswell Apr 29 '14 at 15:24
  • @tcaswell, thank you! It does help, but setting adjustable='box-forced' causes two axes to get separated from each other. I'll update the question with this. – Phlya Apr 29 '14 at 20:30

1 Answers1

2

Re-edited my entire answer as I found the solution to your problem. I solved it using the set_adjustable("box_forced") option as suggested by the comment of tcaswell.

import numpy
import matplotlib.pyplot as plt
from mpl_toolkits.axes_grid1 import host_subplot, make_axes_locatable


#Calculate aspect ratio
def determine_aspect(shape, extent):
    dx = (extent[1] - extent[0]) / float(shape[1])
    dy = (extent[3] - extent[2]) / float(shape[0])
    return dx / dy

data = numpy.random.random((30,60))

shape = data.shape
extent = [-10, 10, -20, 20]
x_size, y_size = 6, 6

fig = plt.figure(figsize = (x_size, y_size))
ax = host_subplot(1, 1, 1)
ax.imshow(data, extent = extent, interpolation = "None", aspect = determine_aspect(shape, extent))

#Determine width and height of the subplot frame
bbox = ax.get_window_extent().transformed(fig.dpi_scale_trans.inverted())
width, height = bbox.width, bbox.height

#Calculate distance, the second plot needs to be elevated by
padding = (y_size - (height - width)) / float(1 / (2. * determine_aspect(shape, extent)))

#Create second image in subplot with shared x-axis
divider = make_axes_locatable(ax)
axPlotx = divider.append_axes("bottom", size = 0.1, pad = -padding, sharex = ax)

#Turn off yticks for axPlotx and xticks for ax 
axPlotx.set_yticks([])
plt.setp(ax.get_xticklabels(), visible=False)

#Make the plot obey the frame
ax.set_adjustable("box-forced")

fig.savefig("test.png", dpi=300, bbox_inches = "tight")

plt.show()

This results in the following image where the x-axis is shared:

enter image description here

Hope that helps!

The Dude
  • 3,795
  • 5
  • 29
  • 47
  • Thank you for your reply! Although your function works perfectly, it still causes the same problems, when I plot two axes together: either lots of white space inside ax1, or separation of ax1 and axPlotx by lots of white space (if I set adjustable='bbox-forced') - see two last picture in the question. – Phlya Apr 29 '14 at 21:34
  • I am a bit confused now. What do you mean with "either lots of white space inside ax1"? Do you mean what you see in the third image in the question? If that is the case could you please try to define `ax1` the same way I did? That is, without `host_subplot`? As indicated in the comment of your code, it is not very important. In my last image there are large white areas around the figure frame. However, as you can see there aren't any large of white areas inside the figure. When saving the figure the white areas around the figure can be removed using the `savefig` option `bbox_inches = "tight"` – The Dude Apr 29 '14 at 21:48
  • Yes, that is what I meant. OK, I will get rid of host_subplot, hopefully it will do the trick, thank you. – Phlya Apr 29 '14 at 21:58
  • Can you maybe show a bit more of your code in terms of packages and plotting the figure? I included `host_subplot` in combination with `determine_aspect` (see updated answer). However, the result remains the same and I do not get large white areas inside `ax` – The Dude Apr 29 '14 at 22:22
  • I think the important thing is that I have another plot under the image - could you try to add it in your example too? I just use plt.show() and save the picture manually. I don't really know, what would be helpful in terms of packages here... I don't do anything unusual in that part. – Phlya Apr 30 '14 at 06:16
  • Could you add the code in which you add the second plot underneath the image? That way I can directly try to make it work using your code. – The Dude Apr 30 '14 at 07:39
  • axPlotx = divider.append_axes("bottom", size=0.1, pad=0, sharex=ax1) - I wrote it in the question. Plot any data you want there, that has the same x-dimension, as the extent you use. – Phlya Apr 30 '14 at 07:58
  • You can shift the second image created using `divider` up and down using `pad`. A negative value will shift it up. More precisely, a value of -2.9 will set it correctly in my example. – The Dude Apr 30 '14 at 11:29
  • Do you know any way to determine the precise value for the pad? Because I want to generate such plots for different data in both images, and it will probably cause different shift between them... – Phlya Apr 30 '14 at 14:21
  • The last update looked promising, but I still get a weird picture (something similar to the 3rd or the 4th pictures in the question, depending on using sharex=ax1 or not) after using your advice :( Using sharex=ax1 can influence the output, could you try with sharing enabled? – Phlya Apr 30 '14 at 21:42
  • I do seem to get something weird when including the `sharex`. However, sharing an axis is similar as having the same `ticks`. You can easily work around it by setting the `ticks` of the second image manually. I've updated my update2. Does this give the final result you were initially looking for? – The Dude Apr 30 '14 at 22:24
  • No, sharing is not similar, because if axes are shared, than in interactive mode moving around one plot causes identical changes in the second plot, and I would really like to have this feature. I will try the updated version in a moment. – Phlya Apr 30 '14 at 22:45
  • Did you just add axPlotx.set_xticks([]) and axPlotx.set_yticks([])? I don't see anything good coming out of it, was there anything else? – Phlya Apr 30 '14 at 22:56
  • I only added the `set_xticks` and `set_yticks`. I'am not sure how to fix it using divider. I'll have a look at it – The Dude Apr 30 '14 at 23:33
  • I don't know why, but with my data it still produces weird results - the lower plot ends up much higher, than the upper one. I might be missing something... I tried running your code, and try this: when the figure is shown, try maximizing or vertical resizing of the window - the plots get separated. If I made it work with my data, I would of course like to be able to change the figure window, and I can't expect a user not to try to resize it. – Phlya May 01 '14 at 12:08
  • When changing the window size, there is indeed a shift between the two images. However, when saved using the parameters I gave it is fixed at the right position. Which is all that matters. Changing the window size of the saved image does not change the relative position of the two images. – The Dude May 01 '14 at 14:06
  • I am sorry, I don't think I can agree with you. As I said, I want to use all this stuff with an interactive window, where one can zoom to different coordinates etc. So resizing that window is quite a possible thing, which a user would like to do. If it causes such behaviour as you can see now, the figure won't be very useful. – Phlya May 01 '14 at 20:52
  • I'm sorry to, as I did answer your question. As for the additional things you want, I can advice you the following: 1) Increase the figure size. Zooming in without changing the `plt.show()` window size does not change anything to the figure. 2) Find a way to keep the aspect ratio of the `plt.show()` window fixed when changing it size. This will also not change anything to the figure. – The Dude May 01 '14 at 21:17
  • OK, thank you for your efforts and advice, I will try to get the perfect result as I see it :) – Phlya May 01 '14 at 21:32
  • Good call on interpolation = "None", that helped me!! – ruoho ruotsi Mar 19 '18 at 16:06