0

I am having a problem with chart properties. Before, there is an option to set the minimum value. I was able to set it but it suddenly changed and I can't find the option to set that again. Does anyone know how to change it from this:

enter image description here

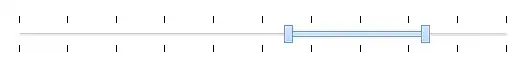
into something like the image below?

enter image description here

user3462803
  • 170
  • 1
  • 2
  • 10
  • can you show your xml with simple sample with just chart? – CompEng Apr 24 '14 at 10:29
  • What version of Cognos? Charting changed drastically in 10.x. If you're in 10.x, in Report Studio, go to `Tools > Advanced`, and see if `Use legacy chart authoring` is checked or cleared. I'm betting it's cleared. Check it, add a chart, and see if you get the option you're looking for. – Andrew Apr 24 '14 at 14:24
  • @Andrew, you can do it in 10x with the new charts, it's just harder to find the option. Took me a few clicks to find. You have to click on the Axis, not on the Axis Values. See http://therealtoddnappi.blogspot.com/2012/12/cognos-10-axis-range.html for pictures. – toddsonofodin Apr 24 '14 at 18:39
  • @Andrew: Thanks but it did not work for me. I am using version 10.2. – user3462803 Apr 25 '14 at 01:58
  • the reason is **CY Actual** is under -%20 right? – CompEng Apr 25 '14 at 05:44
  • @ErsinGülbahar what do you mean under -20%? It doesn't have a value lower than -20. – user3462803 Apr 25 '14 at 06:32
  • do send the the view tabular data? because when I try it on cognos 10.2.1 I see the minumum value is %20 – CompEng Apr 25 '14 at 08:57
  • @ErsinGülbahar I edited again the question. I do have a negative value. – user3462803 Apr 25 '14 at 09:08
  • how can I import report from xml ? – CompEng Apr 25 '14 at 09:20
  • @ErsinGülbahar I don't know how to import a report.-__- – user3462803 Apr 25 '14 at 09:24

1 Answers1

0

Click on axis and set property "Axis Range"

Alexey Baturin
  • 1,173
  • 1
  • 7
  • 11
  • I already set the minimum value. It worked before but suddenly it's not working. :( Do you have any idea why it stopped taking effect? – user3462803 Apr 24 '14 at 09:35
  • I presume you have values below -20%. Drop them or set to -20% btw, what type of chart are you using? – Alexey Baturin Apr 24 '14 at 10:45
  • I don't have a value lower than -20% but I noticed that whenever I remove the data item on x-axis it's working fine. But I need to have a value on x-axis. – user3462803 Apr 24 '14 at 10:47