2

I have data for a CDF in a file which looks like the following:

0.033 0.0010718113612
0.034 0.0016077170418
0.038 0.0021436227224
...  ...
...  ...
0.847 0.999464094319
0.862 1.0

First column is the X-axis value and the second column is the CDF value on Y-axis. I set the line style as follows:

set style line 1 lc rgb 'blue' lt 1 lw 2 pt 7 ps 0.75   # --- blue

and subsequently plot the line with the following:

plot file1 using 1:2 title 'Test Line CDF' with linespoints ls 1

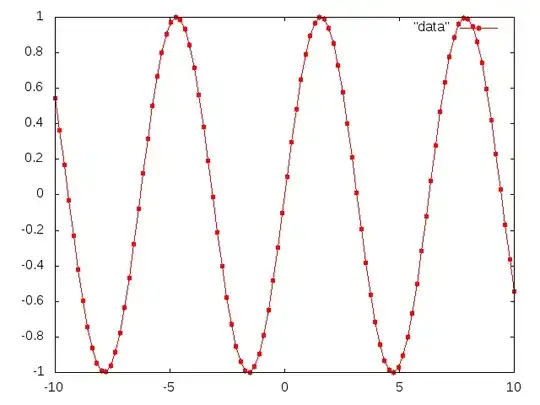
This all works fine, the problem seems to be that my CDF file is pretty big (about 250 rows) and Gnuplot would plot the marker/point (a circle in this case) for every data point. This results in a very "dense" line because of the over-concentration of markers such that the underlying line is almost not visible as I show in an example image below:

enter image description here

How can I selectively draw the markers so that instead of having them on all data points, I plot them after every 50 data points, without having to decrease the number of data points (which I believe is what "every n" in the plot command would do) in my data file or decrease the marker size?

Zahaib Akhtar
  • 1,068
  • 2
  • 11
  • 26
  • I'm not sure I understand your question: Do you want to use the `every n` command only for parts of your curve? Otherwise, why wouldn't skipping `every n` and a reduced marker size work? – Schorsch Apr 17 '14 at 17:00
  • @Schorsch, basically if you use `every n` then you are effectively losing points in your plot, resulting in a CDF which looks a little quantized i.e. loses the nice curve. – Zahaib Akhtar Apr 17 '14 at 17:44

3 Answers3

5

There is no need to use two plots commands, just use the pointinterval option:

plot 'data' pointinterval 5 with linespoints

That plots every line segment, but only every fifth point symbol.

The big advantage is, that you can control the behaviour with set style line:

set style line 1 lc rgb 'blue' lt 1 lw 2 pt 7 ps 0.75 pi 5
plot 'data' w lp ls 1
Christoph
  • 47,569
  • 8
  • 87
  • 187
  • Nice solution. I wonder though, how can I plot a fixed amounts of points instead of plot every 5?. Is that possible? – Nikko Feb 09 '15 at 20:45
  • 1
    @Nikko Not directly. You can use stats to get the number of records and then calculate the step: `stats 'file.dat' using 2; ev = floor(STATS_records); plot 'file.dat' pi ev`. – Christoph Feb 09 '15 at 22:27
1

You can plot the same function twice, once with lines only, and then with points every n points. This will draw less points without decreasing the amount of segments. I think this is what you want to achieve. For this example I have done set table "data" ; plot sin(x) to generate numerical sampling of the sin(x) function.

What you have at the moment is:

plot "data" with linespoints pt 7

which gives

enter image description here

Now you can do the following:

plot "data" with lines, "data" every 10 with points pt 7 lc 1

which gives what you want:

enter image description here

You can change the styling to meet your needs.

Miguel
  • 7,497
  • 2
  • 27
  • 46
1

Although @Miguel beat me to it, but I'm also posting my solution below:

The idea is to once draw the line and then draw the points with the "every n" specifier. I changed my own Gnuplot script in the following manner. A kind of hack but works:

set style line 1 lc rgb 'blue' lt 1 lw 2 pt 7 ps 0   # --- blue

plot file1 using 1:2 title '' with linespoints ls 1, "" using 1:2 every 20 title 'Test Line CDF' with points ls 1 ps 0.75

enter image description here

This retains the nice curve, without quantizing it too coarsely while also keeping the points much better spaced.

Zahaib Akhtar
  • 1,068
  • 2
  • 11
  • 26