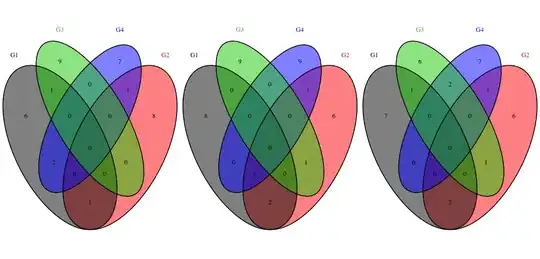
I would like to put together these three venn diagrams. So when I print them, they appear in the same page
library(VennDiagram)
df1 <- data.frame(G1=sample(1:100, 10), G2=sample(1:100, 10),
                  G3=sample(1:100, 10), G4=sample(1:100, 10))
venn.plot.df1 <- venn.diagram(x = as.list(df1), filename = NULL,
                            cat.col = c( "black",   "red",     "green3",  "blue" ),
                            fill=c("black",   "red",     "green3",  "blue"))
grid.draw(venn.plot.df1)

df2 <- data.frame(G1=sample(1:100, 10), G2=sample(1:100, 10),
                  G3=sample(1:100, 10), G4=sample(1:100, 10))
venn.plot.df2 <- venn.diagram(x = as.list(df2), filename = NULL,
                              cat.col = c( "black",   "red",     "green3",  "blue" ),
                              fill=c("black",   "red",     "green3",  "blue"))
grid.draw(venn.plot.df2)

df3 <- data.frame(G1=sample(1:100, 10), G2=sample(1:100, 10),
                  G3=sample(1:100, 10), G4=sample(1:100, 10))
venn.plot.df3 <- venn.diagram(x = as.list(df3), filename = NULL,
                              cat.col = c( "black",   "red",     "green3",  "blue" ),
                              fill=c("black",   "red",     "green3",  "blue"))
grid.draw(venn.plot.df3)
thanks!