Recently I have been working on a robotics project in Java. The robot is instructed to drive around the room logging data about the area around it. The robot has 16 sonar sensors all the way around the robot. The Java code I have written is irrelevant to my question but all it does is drive the robot around and writes data out a CSV file.
The sensors are positioned as follows:
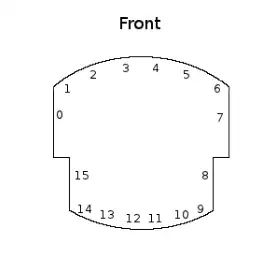
The file looks like this: file output here
Each row in the CSV file contains the following information: xpos, ypos, yaw(in radians), 16 sonar readouts, timestamp
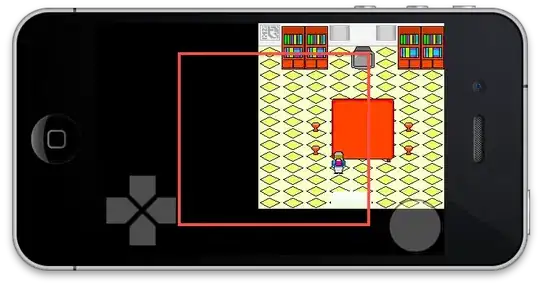
When the robot starts it is in the top right corner facing right. The robot sees the world as a 20x20 grid (-10 to 10).
I am using python to process this information and I am trying to map the environment around the robot. As the CSV file tells me the robots x,y location in the world and the robots yaw I want to then use python Image library to plot the robots position on the image and then add plot a red dot around the robot at the specified distance from the sonar sensors.
Currently I have this code to generate the robots path:
with open('data.csv') as fp:
    for line in fp:
        tempLine = line.split(',')
        x = (float(tempLine[0])+10.0)*100
        y = (float(tempLine[1])+10.0)*100

        idraw.rectangle([(x,2000-y), (x+10,2000-(y+10))], fill=(0,0,0))
Giving the following output:
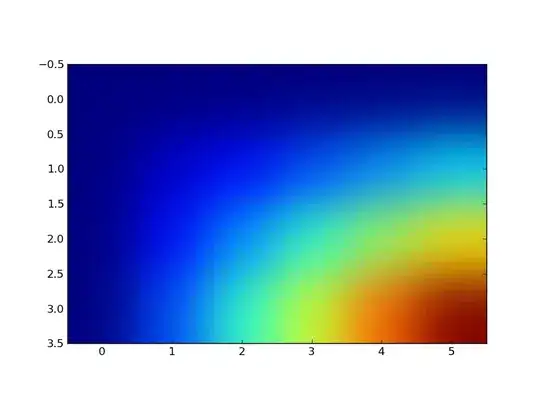
I'm at a lost cause trying to get the sonar points to map. I was taking the approach of working out where the sensors distance is and then rotate the coordinates around the robots yaw.
This has not worked at all and has given me some rather strange results:

Any help will be appreciated! Thanks!