I have a spectrogram like this and I would like to sum up all the occurrences of a given frequency:
I tried to outline the questions that finally have no sense. I apologize for that.
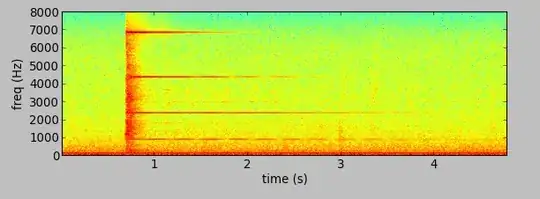
Well the picture shows the information in dB of a wav file, that I load. The picture is the result of specgram method.
As far as I know I can see 4 main features during the time starting from 0.8 sec. in 7k Hz, 4.5 kz, 2.5 kz, 900 hz . Well, it looks like it maintains during the time so I want to add all this occurrences
My source code right now, is something like this. You can see that I get some freq information but this is not corresponding with the graphic values (in the intervals 7k Hz, 4.5 kz, 2.5 kz, 900 hz )
for i in range(0, int(RATE / CHUNK_SIZE * RECORD_SECONDS)):
  # little endian, signed shortdata_chunk
  data_chunk = array('h', stream.read(CHUNK_SIZE))
  if byteorder == 'big':
data_chunk.byteswap()
  data_all.extend(data_chunk)


# Take the fft and square each value
fftData=abs(np.fft.rfft(data_chunk))**2

# find the maximum
which = fftData[1:].argmax() + 1

# use quadratic interpolation around the max
if which != len(fftData)-1:
print "which %f and %f." % (which,which)
y0,y1,y2 = np.log(fftData[which-1:which+2:])
x1 = (y2 - y0) * .5 / (2 * y1 - y2 - y0)
# find the frequency and output it

#==   THIS IS NOT the real freq ======================================
#==   How can I get the values of the freq ???========================
thefreq = (which+x1)*RATE/CHUNK_SIZE
print "The freq is %f Hz. and %d" % (thefreq,int(thefreq) )
else:
thefreq = which*RATE/CHUNK_SIZE
print "The freq is %f Hz." % (thefreq)


Fs = 16000
f = np.arange(1, 9) * 2000
t = np.arange(RECORD_SECONDS * Fs) / Fs
x = np.empty(t.shape)
for i in range(8):
x[i*Fs:(i+1)*Fs] = np.cos(2*np.pi * f[i] * t[i*Fs:(i+1)*Fs])

w = np.hamming(512)
Pxx, freqs, bins = mlab.specgram(data_all, NFFT=512, Fs=Fs, window=w,
                noverlap=464)


#plot the spectrogram in dB
Pxx_dB = np.log10(Pxx)
pyplot.subplots_adjust(hspace=0.4)

pyplot.subplot(311)
ex1 = bins[0], bins[-1], freqs[0], freqs[-1]
pyplot.imshow(np.flipud(Pxx_dB), extent=ex1)
#pyplot.axis('auto')
pyplot.axis('tight')
pyplot.xlabel('time (s)')
pyplot.ylabel('freq (Hz)')


#==   EXTRA LOG                    ======================================

print ("The max number is  >>>>>", np.max(Pxx), " - ",  np.max(bins))
Pxx_dB = np.log10(Pxx)
print ("The max number is  >>>>>", np.max(Pxx_dB))


np.savetxt("./tmp__PXX", Pxx, fmt = '%f')
np.savetxt("./tmp__PXX_dB", Pxx_dB, fmt = '%f')


pyplot.show()
I would like to do something like this  that you can find in this other question
Removing specific frequencies between a range, The thing is how can I count all these frequencies.
that you can find in this other question
Removing specific frequencies between a range, The thing is how can I count all these frequencies.
Thank you.