5

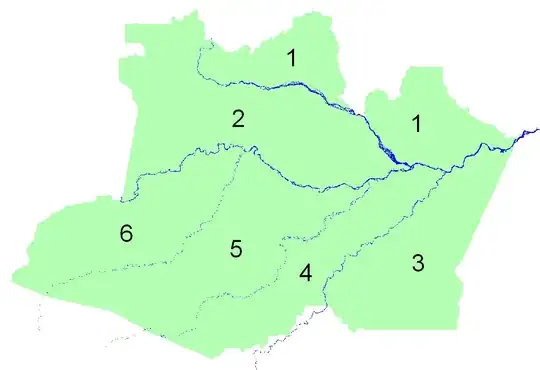
I have a shapefile of Amazonas state (Brazil) and other with the six biggest rivers in this state (Negro, Solimões, Amazonas, Madeira, Purus and Juruá). I want to divide the state using the rivers, to get the interfluvial areas (Madeira-Purus, Purus-Juruá, etc). I want to get the final 6 regions delimited by those rivers, each region as a different polygon. How do I do that?

enter image description here

I'm only finding "clipping" algorithms, and those give me the area of the rivers that are inside the state, and that's not what I want.

Rodrigo
  • 4,706
  • 6
  • 51
  • 94
  • 1
    have you got the rivers as simple centrelines? Because your map shows a lot of structure, especially between 1 and 2 where the river is wide. – Spacedman Mar 24 '14 at 23:43
  • 1
    Check out [this answer](http://stackoverflow.com/a/5865603/489704). – jbaums Mar 25 '14 at 03:32
  • 1
    I was only looking for the words "clip" and "divide", @RichardScriven. "Difference" was the keyword! – Rodrigo Mar 25 '14 at 13:18
  • @Spacedman, yes, there are thousands of islands there. But I'll simply throw them away and keep the bigger polygons. – Rodrigo Mar 25 '14 at 13:18
  • Thanks, jbaums, it worked. It was gDifference I was looking for. If you put this as an answer, I'll accept it. – Rodrigo Mar 25 '14 at 13:19

1 Answers1

5

Following @jbaums comment, I used gDifference, from package rgeos:

intflv <- gDifference(state,rivers)

but since "state" has only one polygon, intflv became a SpatialPolygons object with only one Polygon, made of thousands of sub-polygons. To work better in GIS software, I wanted it to be an object with all the thousands of Polygons, each as a single sub-polygon. So I did:

l <- list()
total <- length(intflv@polygons[[1]]@Polygons)
for (i in 1:total) {
    print(paste(i,total,sep="/"))
    flush.console()
    P <- intflv@polygons[[1]]@Polygons[[i]]
    l[[length(l)+1]] <- Polygons(list(P),i)
}
sp <- SpatialPolygons(l)
d <- data.frame(IDs=1:total)
intflv1 <- SpatialPolygonsDataFrame(sp,data=d)
writeOGR(intflv1,"shp","intflv","ESRI Shapefile")

The result (after keeping only the biggest areas):

enter image description here

Rodrigo
  • 4,706
  • 6
  • 51
  • 94
  • 1
    Thanks for taking the time to provide an answer to your own question. This is something I'm sure I'll come back to in the future. (PS: there's nothing wrong with accepting your own solution.) – jbaums Mar 26 '14 at 08:02