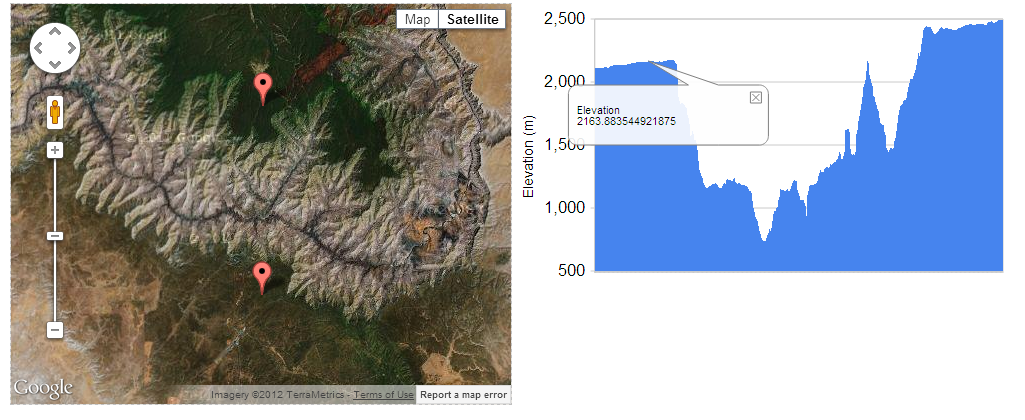
I use a google maps ColumnChart to reprensent the elevation in a map. I also use a mouseover to print info and show the correspondent position. When a column in the chart is clicked, it popups an info balloon, like here:
http://4.bp.blogspot.com/-4I8oi3WqY5o/UIZnzbXql_I/AAAAAAAAAcE/GO4wl6I2-lM/s1600/Charts.png
This balloon is ok for desktops, but a pain for mobile (very hard to close, etc).
How can I completely disable it? It has to do with the second data column passed to the chart. No balloons!
Thanks!
L.
EDIT Code added by request:
var option = {
  legend: 'none',
  backgroundColor: 'transparent',
  colors: ["#C9CFF5"],
  titleColor: '#C9CFF5',
  focusBorderColor: '#00AA00',
  titleY: 'Elevation (m)',
  tooltip: { trigger: 'none' },
  bar: { groupWidth: '100%' }
}
// Build data
var data = new google.visualization.DataTable();
data.addColumn('string', 'Sample');
data.addColumn('number', 'Elevation (m):');
for (var i = 0; i < trackmarks.length; i++) {
  data.addRow(['', trackaltis[i]]);
}

// Draw the chart using the data within its DIV.
chart = new google.visualization.ColumnChart(document.getElementById('elevation_chart'));
chart.draw(data, option);