-1

I have written a function in R which reads a text file and generates a color map using the coordinate information and intensity value for each co-ordiante within that file.

Now, I want to apply a specific threshold value for the intensities such that the intensity values below the specific threshold are suppressed (or are in black) and the intensities above the threshold are represented in the defined color scheme. I basically want to high light areas on the image with high intensity.

I also have another question in this context: Rather than specific values for threshold, can I define a percent? Because, for every image, I have different intensity values and hence different thresholds will have to be applied.

I have attached the image I am working with. enter image description here
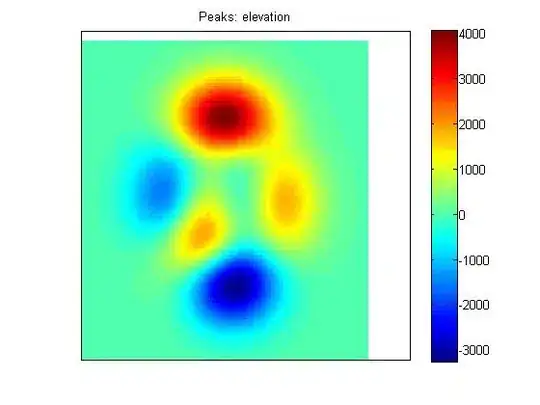
Here is a sample of the data with three columns (xCoordinate, yCoordinate, intensity values)

0 0 4.169080e+000
1 0 6.391669e+000
2 0 6.391669e+000
.
.
.
511 0 9.922547e+000
0 1 5.268026e+000
1 1 5.268026e+000
.
.
.
511 511 9.922547e+000

And, to generate the plot, I read all data from the file and pass it to a function which generates the color map (spplot). Here is the function:

generatePlot <- function (data, plotName) {
  rv <- raster(nrows=data$xPixels, ncols=data$xPixels)
  rv1 <- raster(matrix(data$rawData$V3, nrow = data$xPixels, byrow = T), xmn=0, ymn=0,     xmx=1, ymx=1)
plotData <- spplot(rv1, scales = list(draw = TRUE), col.regions=rainbow(100, start = 1/6, end = 1), main=plotName)

Here is the original image: enter image description here
Here is the thresholded image: enter image description here

lmo
  • 37,904
  • 9
  • 56
  • 69
novicegeek
  • 773
  • 2
  • 9
  • 29
  • 2
    Which function do you use to plot the image? Does adapting the `zlim` do what you want, e.g. `image(X, zlim=c(20,110))`? You can also set values below your threshold to `NA` to suppress them in the plot. – koekenbakker Mar 19 '14 at 13:43
  • I am using spplot(rv1Correctedals, zlim=c(40,110)), main="ALS"). I trying using zlim with it, but it gives the following error: unused argument (zlim = c(40, 110)) – novicegeek Mar 19 '14 at 14:01
  • 1
    `my_image[my_image < threshold_value] <- 0` . What `class` is your image data object? – Carl Witthoft Mar 19 '14 at 14:09
  • Here is how I get the data object using which I construct the image: I have a text file with three columns, first two columns correspond to the co-ordinate information (x and y) and the third column is the intensity value. I read this third column, perform the following function on it: rv1Correctedals <- raster(matrix(transpostedCorrectedals, nrow = 100, byrow = T), xmn=0, ymn=0, xmx=1, ymx=1). Then I plot the rv1Correctedals using spplot – novicegeek Mar 19 '14 at 14:18
  • @koekenbakker I tried your suggestion and it works. I get a white background over which all the regions above the intensity 20 are displayed. But, what I want is the intensities below 20 should be in yellow (showing suppression) or in black. Is this possible? – novicegeek Mar 20 '14 at 09:15

1 Answers1

2

Key is to assign NA to all values below the threshold:

library(sp)
library(raster)

# create data
x = 1:511
y = 1:511
z = runif(n=511*511, min=0, max=10)

# turn into matrix
m = matrix(z, nrow=length(x), ncol=length(y))

# your function
generatePlot <- function (data, plotName) {

  # which values are below 0.5*max?
  below = which(data<0.5*max(data,na.rm=T))

  # change these values to NA
  data[below] <- NA

  # make a raster of the matrix
  rv1 <- raster(data)

  # create the plot
  plotData <- spplot(rv1, scales = list(draw = TRUE), col.regions=rainbow(100, start = 1/6, end = 1), main=plotName)

  return(plotData)
}

plotData = generatePlot(m,'nice plot')
print(plotData)
koekenbakker
  • 3,524
  • 2
  • 21
  • 30
  • I tried your suggestion to use my_image[my_image < threshold_value] <- threshold_value but what I get is an error: (list) object cannot be coerced to type 'double'. And, I also have another question in this context: Rather than specific values for threshold, can I define a percent? Because, for every image, I have different intensity values and hence different thresholds will have to be applied. – novicegeek Apr 14 '14 at 22:41
  • It would be a good idea to update your question with a sample of the dataset. Probably your data are in a list and not in matrix format. check `?as.matrix` or search google for solutions to the error message. Percentage can be defnied of course, e.g. `threshold = 0.5*max(my_image,na.rm=T)`. – koekenbakker Apr 16 '14 at 08:50
  • I have updated the sample data and also the function which I have created to generate the spplot. I tried to implement the percent threshold, but it didnot work with my data or maybe I am doing something wrong in the function. – novicegeek Apr 16 '14 at 15:47
  • The thresholding of the image worked very well until today when I realized that the orientation of the thresholded images is different than the original image. How do I change the orientation of the spplot? I have updated the question with the original plot and the thresholded plot. – novicegeek Apr 27 '14 at 12:28
  • 1
    I don't know the rest of your code, so don't know the origin of the error. However, the difference in orientation seems to be solved by applying transpose (`t`) to your data in the function: `raster(t(data))`. Apparently converting the matrix to a raster transposes the data. – koekenbakker Apr 28 '14 at 09:54