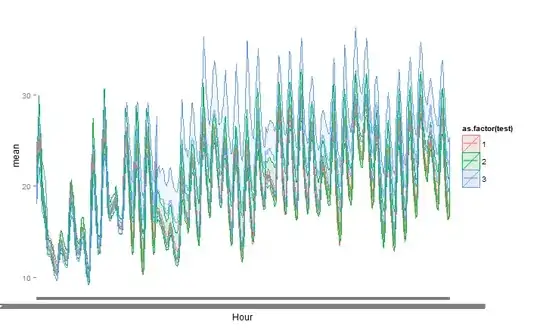
I have hourly temperature data from an old experiment. I would like to summarize the dataset into a graph in ggplot showing the mean temperature of each experimental treatment, and the variation in temperatures within each treatment every hour. I would like to have a non-excel graph that looks something like this:

The data are linked here. https://www.dropbox.com/sh/27cft3118dha6xt/46_xxZZano
I probably have to use reshape to format the data correctly. JD refers to the Julian Day of the year and Time is the hour within that day. Note that labels A-H are treatment 1, I –P are treatment 2 and Q-X are treatment 3. Any advice on how to best go about this would be greatly appreciated.
Many thanks.