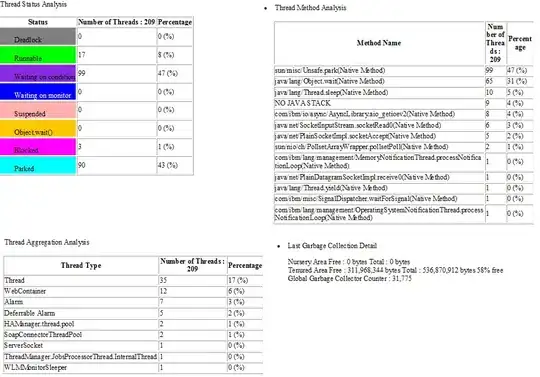
We are using WAS 7 and our ear is deployed on this.
Environment Details
Operating System : AIX 7.1
Processor Architecture : ppc64
Number of Processors : 8
Java version : JRE 1.6.0 AIX ppc64-64 build jvmap6460sr10fp1-20120202_101568 (pap6460sr10fp1-20120321_01(SR10 FP1))
Virtual machine version : VM build 20120202_101568 Just-In-Time(JIT) compiler switch, Ahead-Of-Time (AOT) compiler switch, Compiler version : r9_20111107_21307ifx1
Garbage collector version : GC - 20120202_AA_CMPRSS
Java Heap Information
Maximum Java heap size : 1024m
Initial Java heap size : 512m
I have tried to analyse heap dump using IBM Thread and Monitor Dump Analyser tool.
Below is summary of threads

But I am not able to analyse, whether this statics is good or needs improvement ?
As we have so many threads in Parking / Waiting on Condition consistently (taken thread sump 10 times every day), some times application takes 4 sec to process 5 messages, which suppose to be 5 messages per second.
Application works fine and achieve this SLA of 5 messages per second, but say few times in a day it takes 4 sec to process 5 messages.
Note: Concurrent processing.
And If I am trying to get thread dump at that moment, it is like I shared above.