I have several files that I would like to plot in 2D without interpolation (i.e. a heat map). The data is in three columns (not as a matrix):
#Example data
0 0 1
0 1 -1
0 2 10

1 0 -2
1 1 -0.1
1 2 20
I am using the following commands (Version 4.4):
set pm3d map
set palette rgbformulae 22,13,-31
plot "file" us 1:2:($3>=0?0:$3) notitle w image
which produces the following image:
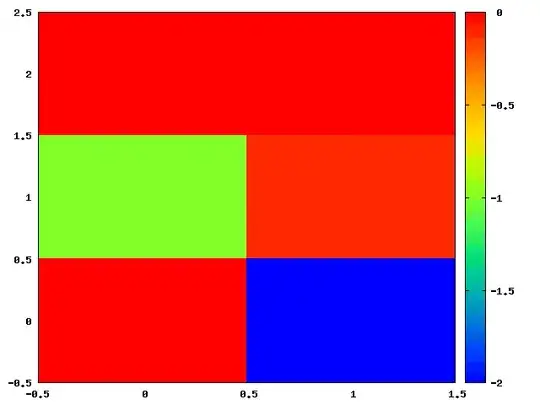
However, what I would like is:
- Ensure that all (column 3) values less than zero will follow the color palette
- Ensure that all (column 3) values greater than or equal to zero are white
- The color bar does not contain white
I want the image to look like this:
Note, that this is only an example. In my real data, the values that are greater than or equal to zero are dispersed throughout the data. I've been playing around with this all morning but have yet to come up with a solution. Any suggestions would be greatly appreciated.