0

I have done a lot of reading on drawing polygons around clusters and realized convhull maybe the best way forward. Basically I am looking for a elastic like polygon to wrap around my cluster points.

My data is matrix consisting of x (1st column) and y(2nd column) points which are grouped in clusters (3rd column). I have 700 such clusters hence not feasible to plot each separately.

Is there a way to perform convhull for each cluster separately and then plot each of them on a single chart.

enter image description here

EDIT

Code I have written until now which isn't able to run convex hull on each individual cluster...

    [ndata, text, alldata] =  xlsread(fullfile(source_dir));

       [~, y] = sort(ndata(:,end));
       As = ndata(y,:);

       lon = As(:,1); 
       lat = As(:,2);
       cluster = As(:,3);

       %% To find number of points in a cluster (repetitions)
   rep = zeros(size(cluster));

   for j = 1:length(cluster)
       rep(j) = sum(cluster==cluster(j));
   end

   %% Less than 3 points in a cluster are filtered out

   x = lon (rep>3);
   y = lat (rep>3);
   z = cluster (rep>3);

   %% convex hull for each cluster plotted ....hold....then display all.

   figure
   hold on

   clusters = unique(z);

       for i = 1:length(z)

          k=convhull(x(z==clusters(i)), y(z==clusters(i)));

          plot(x, y, 'b.'); %# plot cluster points
          plot(x(k),y(k),'r-'); %# plots only k indices, giving the convex hull


      end

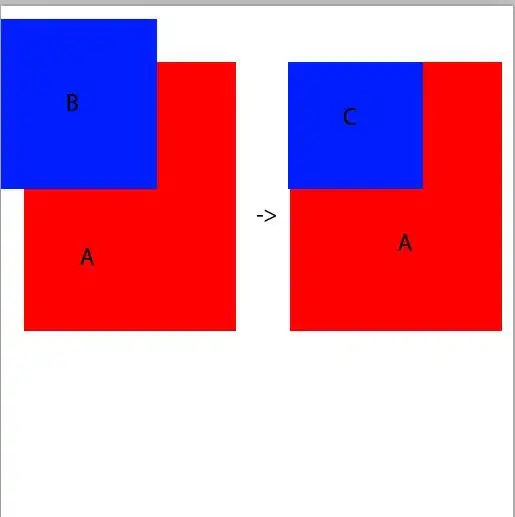
Below is an image of what is being displayed;

If this question has already been asked I apologize for repetition but please do direct me to the answer you'll see fit.

Please can anyone help with this, however trivial I'm really struggling! enter image description here

user3299469
  • 67
  • 1
  • 6
  • Seems like it should be simple enough if you split the data into 700 sets of data points (one for each cluster). Ran the convex hull algorithm for each cluster then plotted the resulting hull. – Nuclearman Mar 03 '14 at 19:08
  • @Nuclearman yes absolutely, but I am not great with matlab and not able to implement it. I have written some code but it implements the convex hull for the whole data set rather than the group. Not sure how to implement it for each cluster separately. EDITED my question to add the code I have for now. – user3299469 Mar 03 '14 at 22:17
  • I suppose I should have expected lack of familiarity as the issue. That's an issue then as I'm not familiar with matlab it either (hence a comment rather than answer). However, you should be able to do it by sorting the data by cluster to group the data by cluster. Then use a for loop to go through each data point and add it to a list of points in that cluster until the cluster changes. When that happens, build and plot the convex hull of the previous cluster list and create a new list with the current point in it as the start of the next cluster list. Just make sure you plot the last cluster. – Nuclearman Mar 03 '14 at 22:46
  • Congratulations. **You are about to write your frist non-trivial program!** It can be implemented using a *for loop*! So get started! – Has QUIT--Anony-Mousse Mar 04 '14 at 08:40
  • Hey @Anony-Mousse I know it isn't a complex problem just that I am not able to implement it. If you can have a look at the code and suggest a solution I'd really appreciate that. Thank you – user3299469 Mar 04 '14 at 10:05
  • I don't use Matlab, because I consider it to be clumsy for my kind of tasks. So I can't help you that much. Any chance that `x(k)` is indexing into the wrong array (unfiltered `x`, instead of `x(z==clusters(i))(k)`)? – Has QUIT--Anony-Mousse Mar 04 '14 at 13:04

1 Answers1

1

I would iterate through all the clusters and do what you already written, and use the hold on option to accumulate all the plots in the same plot. Something like this:

% Generate three clouds of points in 2D:
c1 = bsxfun(@plus, 0.5 * randn(50,2), [1 3]);
c2 = bsxfun(@plus, 0.6 * randn(20,2), [0 0]);
c3 = bsxfun(@plus, 0.4 * randn(20,2), [1 1]);

data = [c1, ones(50,1); ...
        c2, 2*ones(20,1); ...
        c3, 3*ones(20,1)];

% Plot the data points with different colors

clf
plot(c1(:,1), c1(:,2),'r+', 'LineWidth', 2);
hold on
plot(c2(:,1), c2(:,2),'k+', 'LineWidth', 2);
plot(c3(:,1), c3(:,2),'b+', 'LineWidth', 2);

x = data(:,1);
y = data(:,2);
cluster = data(:,3);

clusters = unique(cluster);

for i = 1:length(clusters)
    px = x(cluster == clusters(i));
    py = y(cluster == clusters(i));
    if length(px) > 2
        k = convhull(px, py);
        plot(px(k), py(k), '-');
    end
end

It gives the following result: 2D Clusters and their corresponding Convex Hull

Gastón Bengolea
  • 855
  • 6
  • 13
  • Thank you very much for that and I understand the logic behind that script but when I run it with my data I get an error ??? Error using ==> convhull Error computing the convex hull. Not enough unique points specified. Error in ==> cluster_polygon at 21 k=convhull(x(cluster==clusters(i)), y(cluster==clusters(i))); – user3299469 Mar 03 '14 at 22:50
  • Yeah it seams you need at least 3 different points, but that can be fixed for example by putting an if and checking whether length(cluster==clusters(i)) > 2 and if not, then doing something else (like not drawing the convex hull or just drawing the line that is defined by two points..) – Gastón Bengolea Mar 03 '14 at 22:57
  • Thank you for your edit, as you suggested I have removed those clusters with less than 3 points. But the code still doesn't do what I expect. I have added an image to the question of what it is currently displaying. Can you please help. Thank you very much. – user3299469 Mar 04 '14 at 12:33
  • THANK YOU VERY MUCH!!! It worked you have really been very very very helpful!! Thank you ever so much. Have a great day!! :) – user3299469 Mar 04 '14 at 13:03