7

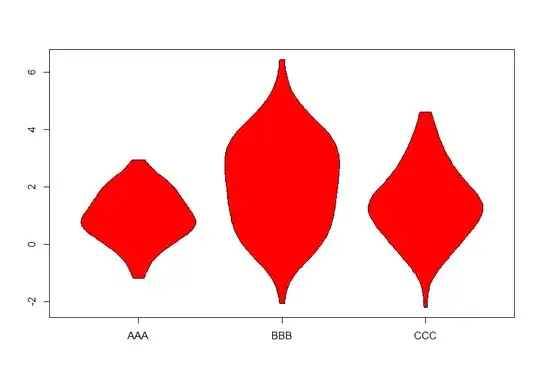
I have a data.frame, for example:

df = data.frame(AAA=rnorm(100,1,1),BBB=rnorm(100,2,1.5),CCC=rnorm(100,1.5,1.2))

And I'd like to plot each of its columns in a joint violin plot.

Here's where I'm at so far:

names(df)[1] = 'x'
do.call('vioplot', c(df,col="red",drawRect=FALSE))

What I want to do next is to plot the colnames of df as x-axis labels rather than the default x-axis labels of vioplot and in addition in a way that they don't run over each other. I imagine this can be achieved either by spreading the columns of df in the plot or by slanting the x-axis labels. But I can't figure that out.

user1701545
  • 5,706
  • 14
  • 49
  • 80

4 Answers4

9

Probably easier to use ggplot

df = data.frame(AAA=rnorm(100,1,1),
                BBB=rnorm(100,2,1.5),
                CCC=rnorm(100,1.5,1.2))

Need to transform the data into something ggplot can handle:

df.m <- reshape2::melt(df, id.vars = NULL)

and plot:

library(ggplot2)
ggplot(df.m, aes(x = variable, y = value)) + geom_violin()

enter image description here

rawr
  • 20,481
  • 4
  • 44
  • 78
5

I like the ggplot solution the best, but here is how you would do it with do.call:

do.call(vioplot,c(unname(df),col='red',drawRect=FALSE,names=list(names(df))))

enter image description here

Notably, you wouldn't have to do names(df)[1] = 'x' because you remove the names with unname.

nograpes
  • 18,623
  • 1
  • 44
  • 67
2

Have you tried dropping the do.call call and doing them individually.

vioplot(df[,"AAA"], df[,"BBB"], df[,"CCC"], 
        col = "red", drawRect = FALSE,names = names(df))

enter image description here

Rich Scriven
  • 97,041
  • 11
  • 181
  • 245
  • I'm trying to avoid a loop for now (my real data.frame has many columns), but I guess I can resort to that if I won't find a better solution – user1701545 Feb 22 '14 at 21:32
1

Another simple option is using the ggviolin function from ggpubr with long formatted data like this:

df = data.frame(AAA=rnorm(100,1,1),BBB=rnorm(100,2,1.5),CCC=rnorm(100,1.5,1.2))
library(dplyr)
library(tidyr)
library(ggpubr)
df %>%
  pivot_longer(cols = everything()) %>%
  ggviolin(x = "name",
           y = "value")

Created on 2022-08-14 by the reprex package (v2.0.1)

Quinten
  • 35,235
  • 5
  • 20
  • 53