I found the following R codes to fit a Tweedie Compound Poisson Gamma distribution. I have to fit it to my 399 claim amounts. I have seen the following R codes ptweedie.series(q, power, mu, phi) and dtweedie.series(y, power, mu, phi). However I fail to understand the codes fully and after importing my data into R, how to proceed? Thanks in advance.
Asked
Active
Viewed 7,660 times
2
www
- 38,575
- 12
- 48
- 84
user3309969
- 55
- 2
- 6
-
To fit a glm using a tweedie distribution, see the examples at the end of [this reference](http://hosho.ees.hokudai.ac.jp/~kubo/Rdoc/library/statmod/html/tweedie.html). For a discussion of the underlying theory, see [this paper](http://lstat.kuleuven.be/research/seminars_events/files/3afmd/Kaas.PDF). If that is not enough, you are more likely to get a full answer if you provide your data (upload to, e.g. Dropbox and provide a link). – jlhoward Feb 16 '14 at 06:14
-
here are my 399 individual total claim amounts (6500,16600,14500,27800,9900,6000,27400,20600,3500,1150,10280,12150,1563162,3500,5500,6000,16150,4500,20000,51540,12500,141811,784760,43000,15600,26840,3000,115100,15500,12700,49200,6300,37500,4000,4600,8500,3000,7700,14600,78400,59700,20600,5000,3500,50900,32000,28850,8000,7400,59750,75900,3000,66900,104500,50300,38750,17500,66400,17670,3949,11150,9653,5000,3000,3000,14050,3000,25000,4000,4500,4750,55000,2000,5500,4750,5000,4500,3000,5000,280000,9500,4500,4500,30000,1500,8000,4500,4800,3000,8000,2500,30000,12000,3500,9600,16000,4000,5500,4000) – user3309969 Feb 16 '14 at 10:51
-
(5000,6000,1200,1000,6200,6300,5500,5000,3500,3500,1250,1300,4600,4000,3600,5000,17300,6000,8000,6000,5500,13500,2500,5500,4500,5900,7000,13000,6700,6800,5000,6200,6300,6100,3600,3300,3500,2900,3000,3150,3250,9900,8700,7300,9600,4000,4500,4100,3350,3950,4250,3850,3950,3500,4000,4550,3000,13300,13900,3000,4550,14650,14400,3500,13550 13900,3900,11000,12000,28000,9000,22000,29000,5500,3000,2500,208009850,18000,27500,20000,28000,22500,20500,27600,28500,18000,18500,18900,11700,3500,3900,20800,21000,5000,8600,10500,10600,9000,9500,12000,12500,11800,7500,9750,9000,8000,9800,5600,9700,7550,3500,6000) – user3309969 Feb 16 '14 at 10:53
-
(11550,10500,5000,12100,7000,7000,8000,8500,9500,5000,4600,4550,3700,2500,2900,5500,5850,3550,2650,4550,6500,7500,6850,8000,10250,6000,7750,6950,6900,7800,7250,25000,28000,19150,32000,28000,27000,19000,19550,16350,20150,20800,12000,25500,26800,29550,24350,13000,25000,49500,44000,27000,25800,9000,10000,8550,8000,9500,8100,11000,11000,7350,7550,4050,14000,14500,13000,15000,19500,20000,25000,30000,21000,39500,43500,21500,8900,18500,18000,19500,8700,19500,6300,12000,15000,18000,40000,36000,25000,39000,37000,30000,33000,37000,25000,18000,20000,21000,19800,35700,60000,19850,25890,52000,15000) – user3309969 Feb 16 '14 at 10:54
-
(17000,19850,8000,16500,8500,11000,10000,12000,13500,18000,6500,6850,25000,22000,32550,19000,11000,23000,21550,22000,23550,30550 35000,9800,23000,26800,23550,23850,15000,26700,26850,32000,70000,73000,71000,29000,35500,76550,78000,50000,46000,47500,57500,35000,36000,58500,57000,50100,39000,60550,48100,56550,3000,4200,3500,2700,11000,12500,12000,8790,14600,6700,10000,19300,12000,12500,20000,25990,27340,20000,15000,64000,25000,29870,32340,39000,32000,19000,15600,14000,28500,34000) @ jlhoward – user3309969 Feb 16 '14 at 10:56
1 Answers
10
First a note: importing your dataset from the comments above yielded 398 claims, not 399. One of these was 4 orders of magnitude larger than the median claim. So I suspect a typo. In the analysis that follows I excluded that sample, leaving 397.
A quick look at the Wikipedia entry for Tweedie Distributions reveals that this is actually a family of exponential distributions distinguished by the power parameter (xi in the R documentation). Power=1 yields the Poisson distribution, power=2 yields the Gamma distribution, power=3 yields the inverse Gaussian distribution, and so on. The Tweedie distributions are also defined for non-integer power. The parameter mu is the mean, and phi is a dispersion parameter, related to variance.
So the basic question, as I understand it, is which combination of power, mu, and phi yield a distribution which best fits your claims data?
One way to assess whether a distribution fits a sample is the Q-Q plot. This plots quantiles of your sample vs. quantiles of the test distribution. If the sample is distributed as the test distribution, the Q-Q plot should be a straight line. In R code (and with X as your vector of samples):
summary(X)        # NOTE: max/median > 1e4 !!!
#     Min.  1st Qu.   Median     Mean  3rd Qu.     Max.
# 1.00e+03 5.50e+03 1.20e+04 5.47e+05 2.50e+04 2.08e+08
X <- X[X<max(X)]   # remove largest value (erroneous??)
hist(X,breaks=c(seq(1,1e5,1000),Inf),xlim=c(0,100000))

library(tweedie)
qqTweedie <- function(xi,p,mu,phi) {
  names <- c("Poisson","Gamma","Inverse Gaussian","Positive Stable")
  plot(qtweedie(p,xi,mu,phi),quantile(X,probs=p),
       main=paste0("Power = ",xi," (",names[xi],")"))
  qqline(X,prob=c(0.25,0.75), col="blue", lty=2,
         distribution=function(p) qtweedie(p,xi,mu,phi))
}
p <- seq(0.02,0.98,length=100)
par(mfrow=c(2,2))
lapply(c(1:4),qqTweedie,p=p,mu=1,phi=1)
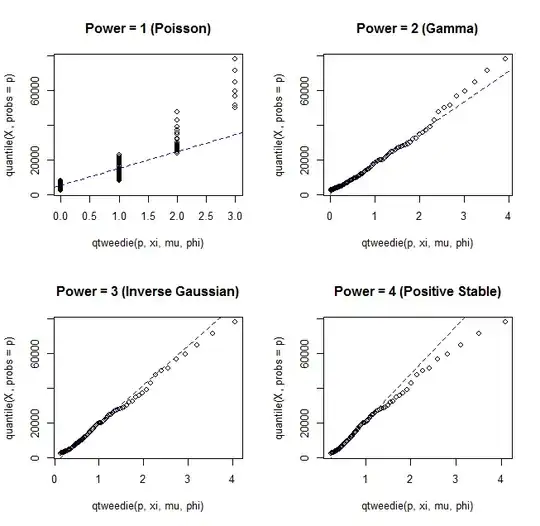
Both the Gamma and the Inverse Gaussian distributions explain your data up to claims of ~40,000. The Gamma distribution underestimates the frequency of larger claims, while the Inverse Gaussian distribution overestimates their frequency. So let's try power=2.5.
par(mfrow=c(1,1))
xi <- 2.5
plot(qtweedie(p,xi,1,1),quantile(X,probs=p),main=paste0("Power = ",xi))
qqline(X,prob=c(0.25,0.75), col="blue", lty=2,
       distribution=function(p) qtweedie(p,xi,1,1))

So your claims data seems to follow a tweedie distribution with power=2.5. The next step is to estimate mu and phi, given power=2.5. This is a non-linear optimization problem in 2 dimensions, so we use package nloptr. It turns out that convergence depends on having starting parameters relatively close the the optimal values, so there is a fair amount of trial and error to get nlopt(...) to converge.
library(nloptr)
F <- function(params){ # Note: xi, Q, and p are defined external to F
  mu  <- params[1]
  phi <- params[2]
  return(sum(Q - qtweedie(p,xi,mu,phi))^2)
}
xi <- 2.5
Q <- quantile(X,p)
opt <- nloptr(x0=c(mu=1e4,phi=.01), eval_f=F, ub=c(5e4,.1), lb = c(1,0),
              opts = list(algorithm="NLOPT_LN_COBYLA",maxeval=1e3,print_level=1))
opt$solution
# [1] 1.884839e+04 9.735325e-03
Finally, we confirm that the solution does indeed fit the data well.
mu  <- opt$solution[1]
phi <- opt$solution[2]
par(mfrow=c(1,1))
hist(X,breaks=c(seq(1,1e5,1000),Inf),xlim=c(0,1e5))
x <- seq(1,1e5,1e3)
lines(x,dtweedie(x,xi,mu,phi),col="red")
jlhoward
- 58,004
- 7
- 97
- 140
-
First of all i thank you for your kind consideration. But actually i have data on automobile claim frequency, the Poisson model fits my data well and for my claim amount the Gamma seems ok..Now i wanted to fit both claim amount and frequency (together) using Tweedie Compound Poisson Gamma distribution. Is it tractable and how to proceed with that? @jlhoward – user3309969 Feb 17 '14 at 12:55
-
So this is back to my original comment. You want a glm using the Tweedie distribution. See also this [reference](http://support.sas.com/rnd/app/examples/stat/tweedie/tweedie.pdf). The data you provided has no predictor variables. – jlhoward Feb 17 '14 at 17:26
-
Yes..My full data set is saved in MS Excel. How can i attach it here?@ jlhoward – user3309969 Feb 17 '14 at 18:25
-
2You have a reference that shows how to do exactly what you are asking, in SAS. You have links to documentation for the R functions that map to the SAS solution. You need to at least make an effort to model this yourself. If that fails, upload your *full* dataset somewhere, (e.g. Dropbox), and post a new question, with a link to your data, with your code, and with a *precise* statement of your problem. Once you've done that, perhaps someone else will try to help you. You might also consider posting on stats.stackexchange.com. – jlhoward Feb 18 '14 at 07:27
-
I think there is a mistake on the sum of squares, i.e., return(sum(Q - qtweedie(p,xi,mu,phi))^2) should be return(sum( ( Q - qtweedie(p,xi,mu,phi))^2 ), i.e., the square is only applying to qtweedie, but it should apply to the difference between Q and qtweedie. – nukimov Sep 09 '20 at 12:26