FastR is a GraalVM based implementation of R. Embedding it in a JVM application is as simple as:
Context ctx = Context.newBuilder("R").allowAllAccess(true).build();
ctx.eval("R", "sum").execute(new int[] {1,2,3});
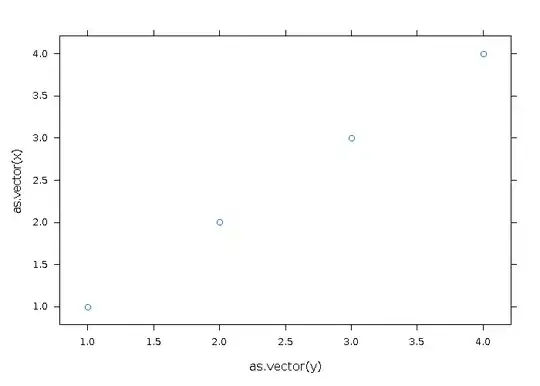
For your concrete example, this example plots a scatter plot using the lattice R package, but the output is drawn into Graphics2D object.
    Context context = Context.newBuilder("R").allowAllAccess(true).build();
    // This R function opens FastR graphics device passing it Graphics2D object,
    // then it plots the graph and closes the device
    String src =
        "library(grid); library(lattice); " +
        "function(graphics, width, height, x, y) { " +
        "   awt(width, height, graphics);" +
        "   print(xyplot(as.vector(x) ~ as.vector(y)));" +
        "   dev.off();" +
        "}";
    Value showPlot = context.eval("R", src);

    // Create a BufferedImage to use for the plotting
    BufferedImage image = new BufferedImage(WIDTH, HEIGHT, TYPE_INT_RGB);
    Graphics2D graphics = (Graphics2D) image.getGraphics();
    graphics.setBackground(new Color(255, 255, 255));
    graphics.clearRect(0, 0, WIDTH, HEIGHT);

    // Invoke R plotting code and pass it graphics object
    double[] x = new double[] {1.,2.,3.,4.};
    double[] y = new double[] {1.,2.,3.,4.};
    showPlot.execute(graphics, WIDTH, HEIGHT, x, y);
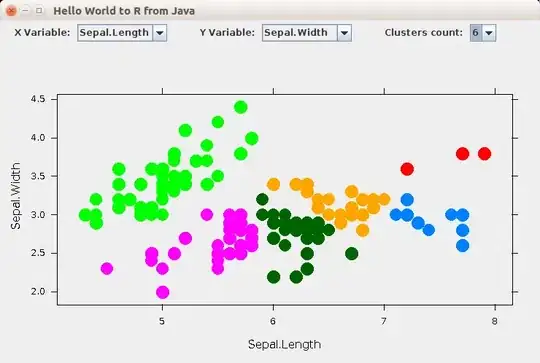
There is also an example that shows the plots inside a Swing window.
You can find more details about FastR in this medium post: https://medium.com/graalvm/faster-r-with-fastr-4b8db0e0dceb

