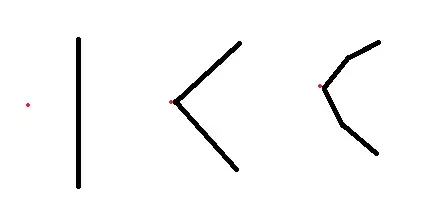
In my jfree line chart the x and y axis line is drawn seperated.. I need to get both the axis meet at the orgin.
Here is the Actual Image im getting from jfree line chart
How to join the two axis line at the orgin in jfree line chart...
I've tried by using this code sample
final DefaultCategoryDataset lineDataset = new DefaultCategoryDataset();
        lineDataset.addValue(10, "Dep", "2009");
        lineDataset.addValue(11, "Dep", "2010");
        lineDataset.addValue(10, "Dep", "2011");
        lineDataset.addValue(10, "Dep", "2012");

        lineDataset.addValue(7, "Dia", "2009");
        lineDataset.addValue(7, "Dia", "2010");
        lineDataset.addValue(7, "Dia", "2011");
        lineDataset.addValue(7, "Dia", "2012");

        lineDataset.addValue(3, "HD", "2009");
        lineDataset.addValue(3, "HD", "2010");
        lineDataset.addValue(3, "HD", "2011");
        lineDataset.addValue(3, "HD", "2012");

        lineDataset.addValue(16, "HBP", "2009");
        lineDataset.addValue(15, "HBP", "2010");
        lineDataset.addValue(18, "HBP", "2011");
        lineDataset.addValue(17, "HBP", "2012");

        lineDataset.addValue(16, "HC", "2009");
        lineDataset.addValue(15, "HC", "2010");
        lineDataset.addValue(16, "HC", "2011");
        lineDataset.addValue(16, "HC", "2012");

        lineDataset.addValue(6, "LBP", "2009");
        lineDataset.addValue(7, "LBP", "2010");
        lineDataset.addValue(6, "LBP", "2011");
        lineDataset.addValue(6, "LBP", "2012");

        final JFreeChart chart = ChartFactory.createLineChart(
                "", // chart title
                "", // domain axis label
                "", // range axis label
                lineDataset, // data
                PlotOrientation.VERTICAL, // orientation
                false, // include legend
                false, // tooltips
                false // urls
        );

        chart.setBackgroundPaint(Color.WHITE);
        final CategoryPlot plot = (CategoryPlot) chart.getPlot();
        plot.setBackgroundPaint(Color.WHITE);
        plot.setOutlineVisible(false);
        plot.setRangeGridlinePaint(Color.white);

        final CategoryAxis categoryAxis = plot.getDomainAxis();
        categoryAxis.setAxisLineVisible(true);
        categoryAxis.setTickMarksVisible(false);
        categoryAxis.setMaximumCategoryLabelLines(2);
        categoryAxis.setLowerMargin(-0.1);

        categoryAxis.setTickLabelPaint(Color.decode("#222222"));
        chart.setPadding(new RectangleInsets(0, -8, 0, 0));

//        categoryAxis.setTickLabelFont(font);
        final NumberAxis rangeAxis = (NumberAxis) plot.getRangeAxis();
        rangeAxis.setVisible(true);
//        rangeAxis.setRange(minRange, maxRange);
//        rangeAxis.setTickUnit(new NumberTickUnit(2));
        rangeAxis.setTickLabelsVisible(true);
        rangeAxis.setLowerMargin(1);

        final LineAndShapeRenderer renderer = (LineAndShapeRenderer) plot.getRenderer();
        renderer.setBaseShapesVisible(true);
        renderer.setBaseShapesFilled(true);
        renderer.setSeriesStroke(0, new BasicStroke(1.2f));
        renderer.setSeriesItemLabelsVisible(1, Boolean.TRUE);
        Shape circle = new Ellipse2D.Double(-3, -3, 6, 6);
        renderer.setSeriesShape(0, circle);
        renderer.setSeriesShape(1, circle);
        renderer.setSeriesShape(2, circle);
        renderer.setSeriesShape(3, circle);
        renderer.setSeriesShape(4, circle);
        renderer.setSeriesShape(5, circle);
//        renderer.setBaseItemLabelGenerator(new CustomLabelGenerator());
        renderer.setItemLabelAnchorOffset(-5);
        renderer.setBaseItemLabelsVisible(true);

        plot.getRenderer().setSeriesPaint(0, Color.decode("#4E7AD3"));
        plot.getRenderer().setSeriesPaint(1, Color.decode("#DC3912"));
        plot.getRenderer().setSeriesPaint(2, Color.decode("#FF9900"));
        plot.getRenderer().setSeriesPaint(3, Color.decode("#109618"));
        plot.getRenderer().setSeriesPaint(4, Color.decode("#990099"));
        plot.getRenderer().setSeriesPaint(5, Color.decode("#0099C6"));
//        renderer.setBaseItemLabelFont(font);

//        plot.getRenderer().setSeriesPaint(1, Color.WHITE);

        try {
            BufferedImage bi;

            bi = chart.createBufferedImage(300, 100);

            ByteArrayOutputStream baos = new ByteArrayOutputStream();
            ImageIO.write(bi, "png", baos);
            byte[] byteArray = baos.toByteArray();
//            rangeAxis.setRangeWithMargins(min(min), max(max));
            String rootpath = this.getRootPath();
            String imagePath = rootpath + TEMP_FILE_PATH + File.separator + "HighLightGraph_" + 1 + ".png";
            System.out.println("=========imagePath============"+imagePath);
            ChartUtilities.saveChartAsPNG(new File(imagePath), chart, 500, 300);
//            this.recordImageData("highlightChart" + "-" + "1", org.apache.catalina.util.Base64.encode(byteArray));
        } catch (Exception e) {

        }