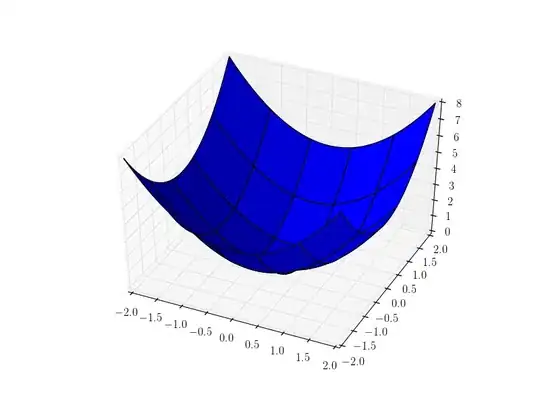
I am updating a 3d scatter plot with every iteration of a loop. When the plot is redrawn, the gridlines "go through" or "cover" the points, which makes my data more difficult to visualize. If I build a single 3d plot (no loop updating) this does not happen. The code below demonstrates the simplest case:
import numpy as np
from matplotlib import pyplot as plt
from mpl_toolkits.mplot3d import Axes3D
import time

X = np.random.rand(100, 3)*10
Y = np.random.rand(100, 3)*5

plt.ion()

fig = plt.figure()
ax = fig.add_subplot(111, projection='3d')
ax.scatter(X[:, 0], X[:, 1], X[:, 2])
plt.draw()

for i in range(0, 20):
    time.sleep(3)   #make changes more apparent/easy to see

    Y = np.random.rand(100, 3)*5
    ax.cla()
    ax.scatter(Y[:, 0], Y[:, 1], Y[:, 2])
    plt.draw()
Has anyone else encountered this problem?

