0

Im using Angular Kendo - Im not sure if thats really relevant only to say its not as 'simple' as calling refresh. - I have two scope variables one is the Kendo DataSource the other is the Kendo Chart Options which are assigned like this

$scope.ChartOptions = {
    // All The other Chart Stuffs
    dataSource : $scope.ChartDataSource
}

<div kendo-chart k-options="ChartOptions" />

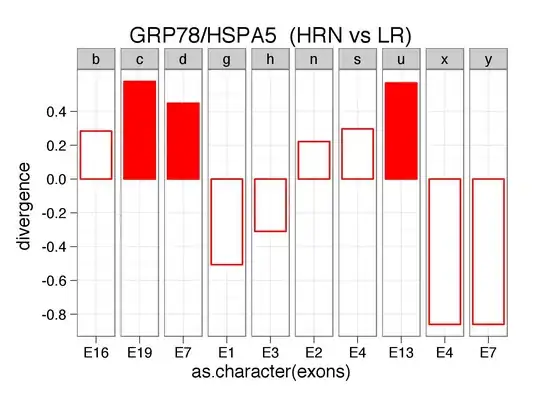
This works fine - the issue is that the chart data can vary quite a bit and the area I'm using is small so what happens is the value axis ends up looking okay with values of just 2 or 3 but when you get to 20 or more the labels bunch up is there some way to reset the options after the data is retrieved. Maybe by changing the valueaxis skips etc.
enter image description here enter image description here

maehue
  • 505
  • 10
  • 26

1 Answers1

0

What you are looking for is actually the CategoryAxis Step value. Based upon your data, you need to figure out what the max value is, and then calculate a reasonable step value that will appropriately render out your chart control based upon the space that you have. I can't really give you an example, as this will be entirely dependent upon your data and will likely require a bit of trial and error til you land on a calculation that yields acceptable results.

Documentation for the CategoryAxis step: http://docs.telerik.com/kendo-ui/api/dataviz/chart#configuration-categoryAxis.labels.step

Here is an example for finding the maximum data point:

var data = [1, 3, 4, 9, 10];
var max = Math.max.apply(Math, data);
//code here to do some kind of calculation of step value

Once you know what your appropriate step value should be based upon your data, you can then create your chart and set the CategoryAxis.Labels.Step value to it during grid creation.

Joe Brunscheon
  • 1,949
  • 20
  • 21