4

Suppose that I have a dataset like the following:

set.seed(1)
dataset <- data.frame(x = sort(rnorm(100)), 
                      y = sort(rlnorm(100))+1:4, 
                      group=rep(letters[1:4], 25))

I would like to create a plot using ggplot2. Instead of choosing colors manually, I use the pre-defined color set Paired:

ggplot(dataset, aes(x = x, colour = group)) + 
geom_line(aes(y=y)) + 
scale_colour_brewer(palette="Paired")

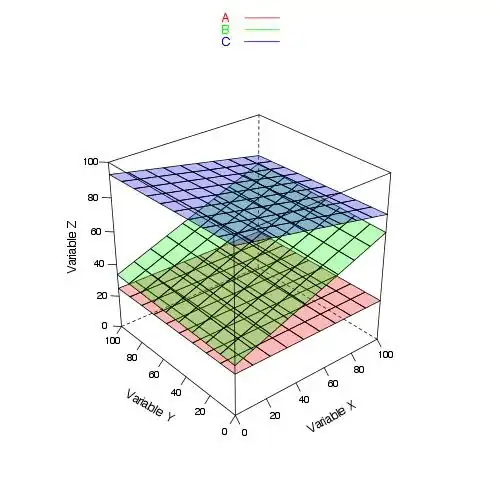
I get the plot as shown below: the data points for groups a and b are in two shades of blue, whereas the data points for groups c and d are in two shades of green.

enter image description here

Suppose now, I would like to only plot the data corresponding to groups c and d, and I would like to use the two shades of green. If I simply do the following:

ggplot(dataset[dataset$group %in% c("c", "d"),], aes(x = x, colour = group)) + 
geom_line(aes(y=y)) + 
scale_colour_brewer(palette="Paired")

the function will automatically select the two shades of blue (see below), since they come first in the Paired palette set.

enter image description here

So my question is: how can I select colors in a pre-defined color set when I use ggplot2

Community
  • 1
  • 1
Alex
  • 4,030
  • 8
  • 40
  • 62
  • 2
    You do it using scale_*_manual but passing in a specific subset of the colors from `brewer_pal`. – joran Jan 30 '14 at 23:45
  • 2
    Not an exact duplicate, but this should give you the idea: http://stackoverflow.com/a/8751004/324364 – joran Jan 30 '14 at 23:46

1 Answers1

10
require(RColorBrewer)
ggplot(dataset[dataset$group %in% c("c", "d"),], aes(x = x, colour = group)) + 
  geom_line(aes(y=y)) + 
  scale_colour_manual(values = brewer.pal(4, "Paired")[3:4])

enter image description here

For a more scalable approach, define the palette globally, outside of the plotting code. You will then be able to dynamically map the subsetted data to the corresponding colour.

tonytonov
  • 25,060
  • 16
  • 82
  • 98