I hope i will be able to get my message across in the right way and tell you what is that i am looking to achieve.
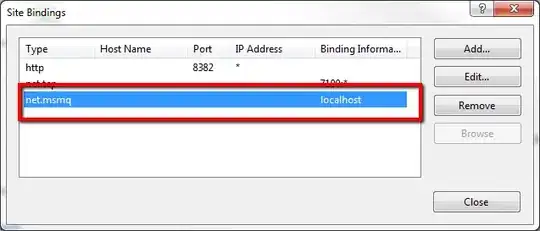
I am using JFreeChart GanttChart in my Swing application to display the scheduling of tasks. Was able to prepare the right dataset and got the chart on the panel. It looks something like this.
There is no problem as such with the overall functionality, but our task scheduling is done in shifts, so it doesn't take up the whole 24 hours in a day. Say for example, in our case the operating hours are only from 0800 hrs - 1600 hrs. My dataset conforms to this as well. As you can see in the image, Step 7 is a task with a duration of 2 hours, starts on 1500 hrs on 22nd Jan and ends at 0900 on the next day ( 1 hour on both days because the operating hours ends at 1600 and starts at 0800 only on the next day).
But looking at the graph, makes step 7 to be one of the longest tasks in the event, just because the graph is also considering the non-operating hours into account. Is there a way to change the range axis / date axis to consider the time periods only in custom hours or trim down the non-operating hours (1600-0800 hrs in my case )?.
Unfortunately, i don't have the JFreeChart Dev Guide to probe further.
Below are my snippets for generating the dataset and creating the chart
                 for (int i = 0; i < tempList.size(); i++) {

                     GanttChartPojo tempGCPojo = new GanttChartPojo();
                     tempGCPojo = tempList.get(i);
                     s1.add(new Task(tempGCPojo.getTaskStepDesc(), tempGCPojo.getEST(), tempGCPojo.getEFT()));
                     s2.add(new Task(tempGCPojo.getTaskStepDesc(), tempGCPojo.getLST(), tempGCPojo.getLFT()));


             }
         }
     }

     // Add the task series to a TaskSeriesCollection
     final TaskSeriesCollection collection = new TaskSeriesCollection();
     collection.add(s1);
     collection.add(s2);
Create Chart Code
 // create the chart...
    final JFreeChart chart = ChartFactory.createGanttChart(
        "Scheduling of Task Steps : Maintenance Event "+eventKey,      // chart title
        "Task",                      // x axis label
        "Time",                      // y axis label
        dataset,                  // data
        true,                     // include legend
        true,                     // tooltips
        false                     // urls
    );


    chart.setBackgroundPaint(Color.pink);


    return chart;

}
UPDATE: After looking up on the internet extensively, i found out that i can eliminate this non-working hours using SegmentedTimeline API. Anyone who has used it before, please help me in removing the non-working hours away from the plot?