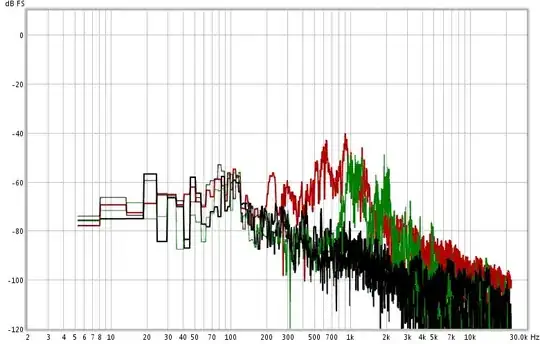
I am trying to use MATLAB to import a WAV file and create the type of diagram shown below. I am basically trying to pull frequency information and plot it according to decibels. Here is the code I am working with, but it doesn't seem to pull the frequency information correctly:
[x fs]=wavread('filename.wav');
dt=1/fs;%% time interval

X=fft(x);
df=1/(length(x)*dt); %% frequency interval
f=(1:length(X))*df;%% frequency vector

%% frequency domain plot, freq in hertz
figure
plot(f,abs(X))
Please help! Thank you!