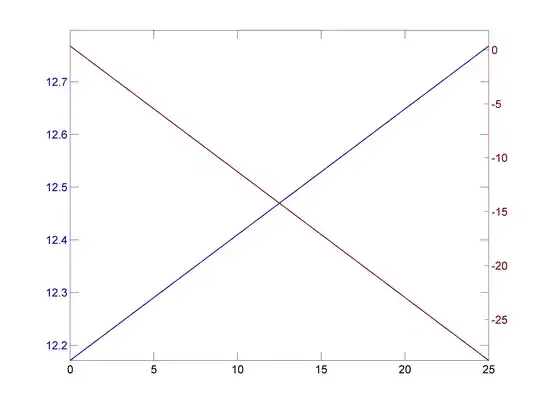
I am using win7 and octave 3.6.4, when i generate a plot with octave and save as .eps its colors go away. For example :
clf();
surf(peaks);
generates following graphic
But when i run the following codes seperately
saveas (1,"test.eps") or print (1,"test.eps") or print -deps test.eps
to save the graphic as .eps and import it into latex it becomes grayscale.