15

I am using the scatterplot function from the car package to generate a scatterplot. I want to be able to generate a reference line in the plot that should be x=y. I tried using abline and it does add a line but it is not the x=y line. Can someone help?

My code is as follows:

scatterplot(phenos$P1~pheno$P0, data=pheno,spread=FALSE,ylab="6 month timepoint", xlab="Baseline Timepoint", jitter=list(x=1, y=1))
abline(0,1)

Thanks.

CadisEtRama
  • 1,071
  • 5
  • 18
  • 31
  • I suppose you create a boxplot instead of a scatterplot. Right? – Sven Hohenstein Dec 06 '13 at 20:46
  • 1
    What do you get? What sort of data is `P1` and `P0`? – John Paul Dec 06 '13 at 20:47
  • 1
    abline(0,1) adds a line of slope=1 and intercept=0, so it should give you what you need. If you provide some data to plot (so we can see what you're seeing when you run the scatterplot and abline commands), we can provide more help. – eipi10 Dec 06 '13 at 20:47
  • to get x=y , `lines(pheno$P0,pheno$P0)` – agstudy Dec 06 '13 at 21:09
  • `car::scatterplot` does a lot of fancy stuff internally, including using the `layout()` function, which is going to make it much more difficult to overlay something simple like a 1:1 line ... – Ben Bolker Dec 06 '13 at 21:40

3 Answers3

14

You can achieve your goal by the same function abline. Use the function abline(a=0, b=1) where a and b are the intercept and slop of the line respectively. This draws you a straight line of the form Y = a + b*x.

Hope this helps.

4

I just use the segments function: segments(x0=0,y0=0,x1=45,y1=45)

Just make the y values go just above the limits of your plot.

This function is also nice because it doesn't change your x and y limits so the line can run clean across your graph without having to accurately pick the x and y values.

1

This is actually fairly difficult/hackish, because scatterplot() internally uses layout, which makes it hard to control the subplot currently being used by the graphics driver. (Update: it's harder than I thought -- setting par("mfg") must have been working more or less by accident.)

Make up data (update: using data with mean x and y not equal zero and not equal to each other, as it illustrate the difficulties of naively using abline() more clearly)

set.seed(1)
d <- data.frame(x=rnorm(10,mean=10),y=rnorm(10,mean=12))
library(car)

Try my old strategy (which doesn't actually work, or works only unpredictably):

scatterplot(y~x,data=d,reset.par=FALSE)
k <- 1              
for (i in 1:2) {
   for (j in 1:2) {
      par(mfg=c(i,j,2,2))
        abline(0,1,lwd=3,col=k)
        k <- k+1
  }

}

Depending on how I do this, I either get warnings and errors or bogus answers. It seems to matter whether I do the scatterplot() call inside a function ... ??

enter image description here

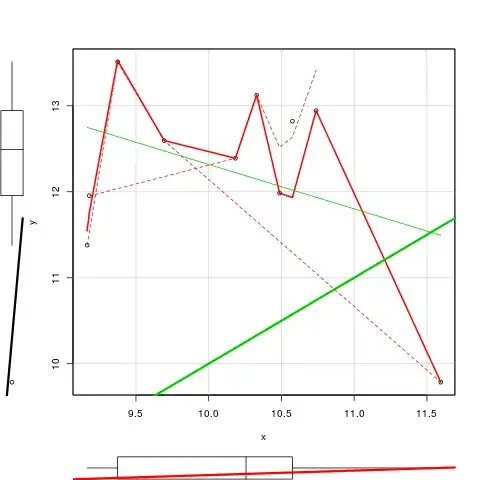
Second try, more conservatively: reconstruct layout from scratch.

 scatterplot(y~x,data=d)
 uu <- par("usr")
 ## mimic layout frolm car:::scatterplot.default.  Would be different if we were drawing only one
 ## of x-boxes or y-boxes
 layout(matrix(c(1, 0, 3, 2), 2, 2), widths = c(5, 95), 
        heights = c(95, 5))
 oldmar <- par(mar=rep(0,4))  ## zero out margins so we can plot in sub-boxes without errors
 ## now skip through the first two sub-plots
 par(new=TRUE); plot.new(); par(new=TRUE); plot.new()
 par(oldmar)  ## reset margins
 ## blank plot with user limits set and 'interior' axis calculations
 plot(0:1,0:1,xlab="",ylab="",xlim=uu[1:2],ylim=uu[3:4],xaxs="i",yaxs="i")
 ## add annotation
 abline(a=0,b=1,col=4,lwd=3)              

enter image description here

Given the amount of effort and fragility of this solution, it might actually be best to hack scatterplot to optionally allow abline() to be specified additionally, or to ask the maintainer for that capability ...

Ben Bolker
  • 211,554
  • 25
  • 370
  • 453
  • Ben, I found that I didn't need to do any of the parameter setting to get a y=x line to plot properly. I just did `scatterplot(y~x,data=d)` and then `abline(0,1)` and the y=x line was correctly plotted. Do you get the same behavior? – eipi10 Dec 06 '13 at 22:07
  • Addendum: I tried the same thing with several different random data sets and found that sometimes abline gives a line with y-intercept = 0 and sometimes the y-intercept is shifted very slightly below zero (but I always get the correct slope=1). So I stand corrected. – eipi10 Dec 06 '13 at 22:16
  • I think it's going to depend on whether the plot setup *happens* to correspond to something where (0,0) is close to the middle of the plot. Try it with means different from (0,0) and see what happens ... – Ben Bolker Dec 06 '13 at 23:05
  • @eipi10 when I try the 'abline(0,1)', I get a line that is a little below zero. It's almost "there" but not really. Ben, that code did not work for me, I kept getting errors, I found it hard to follow how you did this, sorry! I mainly wanted to use 'scatterplot()' for the boxplots on the axes. I may have to try to revert to base graphics in R to generate the x=y line. Do you guys know how to add box plots to the axes using base graphics then? – CadisEtRama Dec 07 '13 at 00:22
  • 1
    give us a *reproducible* example of something that doesn't work, please. – Ben Bolker Dec 07 '13 at 01:12
  • @BenBolker as you predicted, the y-interecept moves around slightly, depending on means of the plotted points. – eipi10 Dec 09 '13 at 18:10
  • that's nice (I assume you mean if you're just using `abline()` without any of the fancy stuff in my answer), but ... I'm not surprised. You need to be more specific about what "that code did not work for me, I kept getting errors" means -- and if at all possible, show us *exactly* by putting together a reproducible answer -- see http://tinyurl.com/reproducible-000 – Ben Bolker Dec 09 '13 at 18:24
  • I actually just ended up creating the plot in ggplot2 and it worked. thank you though. – CadisEtRama Dec 16 '13 at 02:11