5

I'm able to plot some weather data onto a map using the following code. However the points are rectangles and i'd like to get them smoother.

Rectangles Plotted,

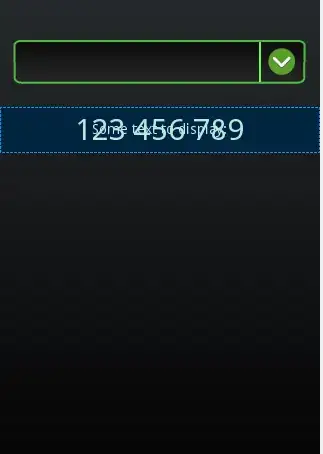
I'd like to plot them smoother like something similar to Ideal plot points

I believe I need to look into interpolating, spatial analysis, and/or Choropleth maps. I think they are different algorithms in doing this. I feel like i need to fill in more points in between the existing ones? And with that is it possible to make gradient like points? Is this doable in D3? Or should i consider using three.js or WebGL stuff?

var width = 960,
height = 960;

var map = {};
var projection = d3.geo.mercator()
.scale((width + 1) / 2 / Math.PI)
.translate([width / 2, height / 2])
.precision(.1);

var path = d3.geo.path()
.projection(projection);

var graticule = d3.geo.graticule();

var svg = d3.select("body").append("svg")
.attr("width", width)
.attr("height", height);

svg.append("path")
.datum(graticule)
.attr("class", "graticule")
.attr("d", path);

d3.json("world-50m.json", function(error, world) {
 svg.insert("path", ".graticule")
  .datum(topojson.feature(world, world.objects.land))
  .attr("class", "land")
  .attr("d", path);

svg.insert("path", ".graticule")
  .datum(topojson.mesh(world, world.objects.countries, function(a, b) { return a !== b; }))
  .attr("class", "boundary")
  .attr("d", path);
});

map.plot_points = [];
map.max = 30;
map.min = -1;
var opacity = d3.scale.linear()
 .domain([map.min, map.max])
 .range([0,1]);  
var rainbow = ["#CE0C82", "#800CCE", "#1F0CCE", "#0C5BCE", "#0C99CE", "#2ECE0C", "#BAE806", "#FEFF00", "#FFCD00", "#FF9A00", "#FF6000", "#FF0000"];
zs.forEach(function(zv,zi){
    zv.forEach(function(zzv, zzi){
        if(zzv != 999)
            {
                map.plot_points.push({lat: ys[zi], long:xs[zzi],value:zzv});
            }

        })
});
console.log(map);
var points = svg.selectAll("rects.points")
 .data(map.plot_points)
 .enter()
 .append("rect")
 .attr("class", "points")
 .style("fill", function(d) {
   var scale = d3.scale.linear().domain([map.min, map.max]).range([1, rainbow.length]);
        return rainbow[Math.round(scale(d.value))]; 
}).attr("width", 8)
.attr("height", 8)
.style("fill-opacity", 1)
.attr("transform", function(d) {
        return "translate(" + projection([d.long, d.lat]) + ")";
})
user176855
  • 289
  • 1
  • 6
  • 17

4 Answers4

2

It sounds like the problem in your case is the data. What you would need to do is take the original data and interpolate it to a smoother form. For this, you can use a GIS program such as QGIS. How exactly to do that depends on what format your original data is in.

Once you have the smoother data, you can plot it again in D3. My guess is that the end result would be somewhat similar to what I've done here, where contour lines are drawn to much the same effect as what you're aiming for.

Lars Kotthoff
  • 107,425
  • 16
  • 204
  • 204
  • What kind of algorithms are used to make smoother data? I've been trying to do this via javsacript only. conrec is the closest however it only works on even points. – user176855 Dec 17 '13 at 23:21
  • I'm not aware of anything in Javascript; I highly recommend using a GIS program for that. – Lars Kotthoff Dec 18 '13 at 08:59
2

Maybe you could take a look into heatmap js.

http://www.patrick-wied.at/static/heatmapjs/

Although is point based it may give you a hint. It uses canvas instead of svg.

Xumo
  • 136
  • 4
1

Jason Davies wrote an implementation of the conrec algorithm that does exactly what you need:

https://github.com/jasondavies/conrec.js It's got a working example inside

Roger Veciana
  • 983
  • 1
  • 12
  • 25
  • I think conrec.js is the way to go or d3.geo.contour(), however how do i translate a (longitude, latitude, value) or (x,y,value) into something for contour? – user176855 Dec 10 '13 at 02:13
  • In the example you can see that you need three arrays, with the x, y and value values: https://github.com/jasondavies/conrec.js/blob/master/example/example.html I don't know if this was your question... – Roger Veciana Dec 10 '13 at 08:46
1

I believe that the white stripes are happening because of the projection you are using; In fact the height of each rectangle should adjust accordingly going north and south from the Equator, because the Mercator projection alters the distance going north and south.
To have a fixed height of the rectangles you could try with this projection instead:
http://bl.ocks.org/mbostock/3757119
which preserves the dimension going north and south

tomtomtom
  • 1,502
  • 1
  • 18
  • 27