I came across this question and thought the data input can be made more user-friendly. In case you need to change x,y coordinates of a certain point you probably don't want to search through all connectors and change the coordinates everywhere accordingly. So, instead the example below is working with node IDs and connecting lines between two IDs.
The x,y coordinates and colors are stored in a string and the function strstrt() is used to create a lookup. The script below is a starting point and can be expanded, e.g. dashed lines, different point shapes, string labels, etc.
The datafile looks like this:
- first block: IDs with x,y coordinates and color
- second block, separated by two(!) blank lines: IDs to be connected and color of the line.
Data: SO20406346.dat
# ID  x     y     PointColor
  1   2.0   8.0   0xffaaaa
  2   6.0   9.0   0xaaffaa
  3   9.0   6.0   0xaaaaff
  4   5.0   5.0   0xffaaff
  5   6.0   2.0   0xffffaa
  6   1.0   1.0   0xaaffff
 73   9.2   1.3   0xcccccc
  A   8.0   8.0   0xcccccc
 XY   2.0   4.0   0xcccccc


# ID1 ID2   LineColor
  1   4     0x0000ff
  2   4     0x000000
  3   4     0x00ff00
  4   4     0x000000
  5   4     0x000000
  6   5     0xff0000
 73   3     0xcccccc
 73   4     0xcccccc
 73   5     0xcccccc
  A   2     0xcccccc
  A   3     0xcccccc
 XY   1     0xcccccc
 XY   4     0xcccccc
 XY   6     0xcccccc
Edit: changed to work with string "IDs" as well.
Script: (works for gnuplot>=4.6.0, March 2012)
### plot a node graph
reset

FILE = "SO20406346.dat"

IdIdxs = XYs = ' '
stats FILE u (IdIdxs=IdIdxs.sprintf("%s:%d ",strcol(1),$0), \
              XYs=XYs.sprintf("%g %g ",$2,$3)) index 0 nooutput
Px(i) = real(word(XYs,2*i+1))
Py(i) = real(word(XYs,2*i+2))

getIdx(col) = (c0=strstrt(IdIdxs,sprintf(" %s:",strcol(col))), \
              c1=strstrt(IdIdxs[c0+1:],' ')+c0, \
              s0=IdIdxs[c0:c1], c2=strstrt(s0,':'), int(s0[c2+1:]))

set size ratio 1
set key noautotitle
set offsets 0.25,0.25,0.25,0.25

plot FILE index 1 u (idx0=getIdx(1),x0=Px(idx0)):(y0=Py(idx0)): \
         (idx1=getIdx(2),Px(idx1)-x0):(Py(idx1)-y0):3 w vec lw 2 lc rgb var nohead, \
       '' index 0 u 2:3:4 w p pt 7 ps 6 lc rgb var, \
       '' index 0 u 2:3 w p pt 6 ps 6 lc rgb "black", \
       '' index 0 u 2:3:1 w labels
### end of script
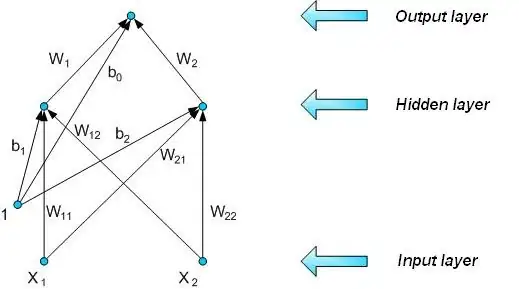
Result: