I am trying to implement a graph view in my android app. It should be able to enter a function. (eg.: f(x1) = x², or f(x) = sin(x) + 5)
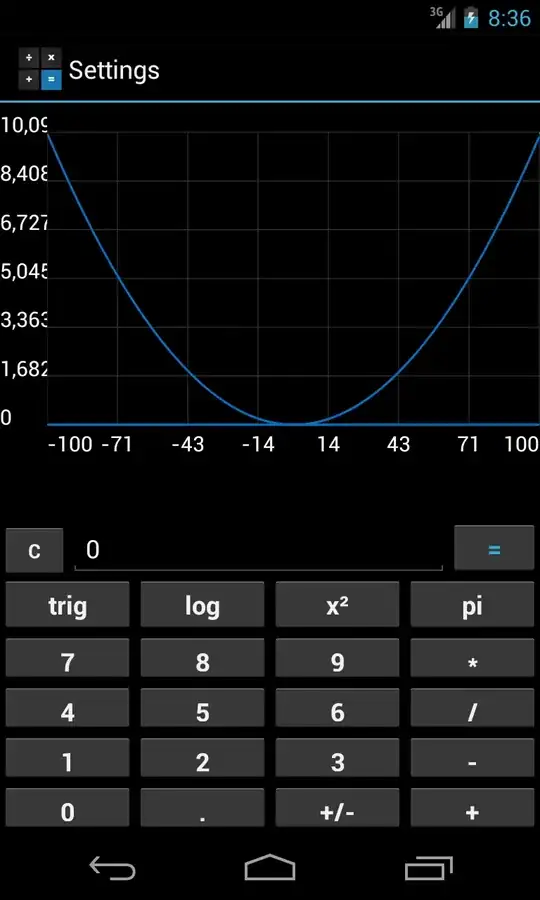
For that i will need a coordinate system where i can later draw my function after calculating about 50 points. It should later look similar to that:

I already tried it with the android libary GraphView and i was able to draw something but in this libary i don't have a coordinate so that my graph is "somewhere";
        int num = 400;
    GraphViewData[] data = new GraphViewData[num];
    GraphViewData[] data2 = new GraphViewData[num];
    double x = -100;
    double y = 0;

    //Coordinate system x
    for (int i=0; i<num; i++) {
           data[i] = new GraphViewData(x, y);
           x = x + 0.5;
        }

     x = 0;
     y = -100;
    for (int i=0; i<num; i++) {
           data2[i] = new GraphViewData(x, y);
           y = y + 0.5;
        }

     x = -100;
     y = 0;

    GraphViewData[] data3 = new GraphViewData[num];
    //Coordinate system y
    for (int i=0; i<num; i++) {
           y = (x * x);
           data3[i] = new GraphViewData(x, y);
           x = x + 0.5;
        }
    // sin curve

    for (int i=0; i<num; i++) {
       y = Math.sin(x);
       y = x * x + 50;
       data2[i] = new GraphViewData(x, y);
       x = x + 0.2;
    }


    GraphView graphView = new LineGraphView(
          this
          , ""
    );


    // add data
    graphView.addSeries(new GraphViewSeries(data));
    graphView.addSeries(new GraphViewSeries(data2));
    graphView.addSeries(new GraphViewSeries(data3));
    // set view port, start=-100, size=200
    graphView.setViewPort(-100, 200);

    graphView.setScrollable(false);
    graphView.setScalable(false);

    LinearLayout layout = (LinearLayout) findViewById(R.id.graph1);
    layout.addView(graphView);
With data1 and data2 i am able to draw a Coordinate system:

but as soon as i add data3 it looks like: (because of the huge amount)
Any idea on that ? What is the best and easiest way to do this ? (I don't need multiple lines or scalable) I guess this is a wrong library because there is no correct way to draw this, is it?
Thanks !
EDIT: working fine with: graphView.setManualYAxisBounds(100, -100);

Thanks alot jjo64