2

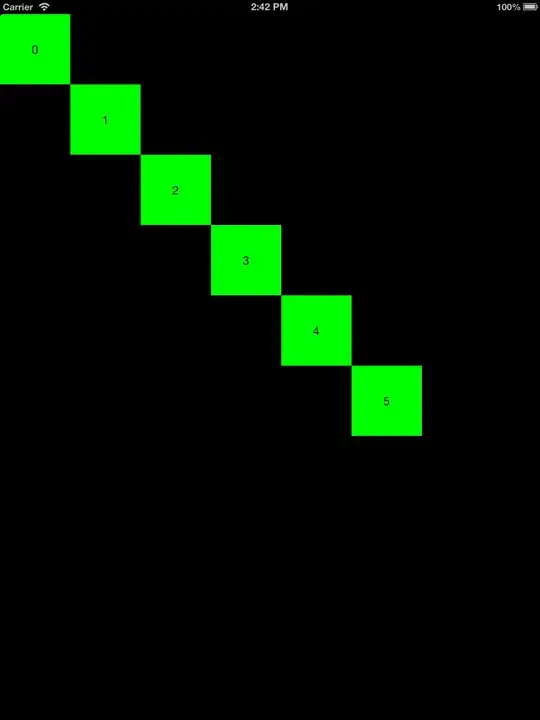
please view the image below for a clearer idea what I am about to ask.

enter image description here

I believe all of you can see the number of books in this image, which is 3. I have tried segmenting them according to their intensity, watershed. Even using Canny was not really successful due to the noises. But all in all, with the exception of canny, the image always look something like that(See the left picture): enter image description here

Where all the books are clustered together. My aim is to ultimately separate them and use bwboundaries to count the number of books. I was also trying out label2rgb to further differentiate the books, however, all that happened that its was only one colour, meaning MatLab took it as all 3 books are the same.

I have done this on hardcover books with great success, however as this books are not hard cover, there isn't a distinct line to separate each of them.

I been trying to segment this image without success for a few days. Any ideas? Any suggestions or ideas are welcomed.

Shai
  • 111,146
  • 38
  • 238
  • 371
rockinfresh
  • 2,068
  • 4
  • 28
  • 46
  • 1
    plot the `mean` (or `median`) along the second dimension of the gray-scale image. I believe it will help you counting the books. – Shai Oct 28 '13 at 19:24
  • Thanks. I am trying it out now. You mean to look at the peaks and valleys of the the plot right? – rockinfresh Oct 29 '13 at 18:23
  • This technique of finding the mean value along each horizontal row is similar to a suggestion I made for segmenting lines of text. At the very least you can see what peaks and values along each horizontal row would look like for a real image. http://stackoverflow.com/questions/8015001/is-there-an-efficient-algorithm-for-segmentation-of-handwritten-text/8875390#8875390 – Rethunk Nov 09 '13 at 01:15

3 Answers3

1

Take a slice along the y axis at an x value such that you have nice boundaries. Then use "conv" to find the convolution of that 1-d vector (containing 0s and 1s) with the central part of an odd Gaussian function. This is like an edge filter, but will be robust to noise. That convolution will give you a bunch of irregularly-spaced peaks. Find the peaks, and count them. Each peak is the boundary between two books. (Sorry, this easy process is very hard to explain without a whiteboard.)

"central part of an odd Gaussian function" = imagine a sine function, cut off at plus/minus pi. But the change from positive to negative is closer to a step function. I think you could get what you want by convolving a Gaussian and a step function. (Again, sorry for no whiteboard.)

edit2: Here is some Matlab code, to be run interactively so you can see what I mean:

x=[-9.5:1:9.5];
y=[-1 -1 -1 -1 -1 -1 -1 -1 -1 -1 1 1 1 1 1 1 1 1 1 1]; plot(x,y,'.');
g=exp(-x.*x/8); plot(x,g,'.');
odd_g=conv(y,g);plot([-19:19],odd_g,'.')

So, odd_g (or something similar) is the thing you'd want to convolve with the image slice at a given x.

peaks=conv(image_slice,odd_g);

edit3: Suppose you had

image_slice=[1 1 1 1 1 1 1 0 0 0 0 0 0 1 1 1 1 1 1 1 0 0 0 0 0 0 0 0 0 0 1 0 1 0 1 1 1 1 1 1 1 1];

and notice that I've put in a noisy edge. For the chosen values, when you plot the convolution,

plot(conv(image_slice,odd_g)

you see that the noise at the one edge gives a slight peak, but it's not as large as a true edge. So you'd find the peaks and discard any less than some cutoff value. And of course pick parameters for odd_g that are best suited to your data.

dmm
  • 495
  • 5
  • 12
1

For me this is a classical problem in morphological filtering. We can see that as we improve the threshold we have different parts of the books that are visible.

Threshold at 100 Threshold at 150 and Threshold at 172

Now some grayscale filtering based on the area/size of the grayscale components can provide with some good segmentation. This is called an area opening in morphological filtering: http://www.mathworks.fr/fr/help/images/ref/bwareaopen.html

This basically removes connected components whose size/area is lesser than a certain parameter. Thus to see this in action here are a few filtered images of the thresholds above.

Area opening and closing

Another gray level

    x150 = I>150;
    x100 = I>100;
    x172 = I>172;
    x150_op = bwareaopen(x150,80);
    x172_op = bwareaopen(x172,300);
    figure, imshow(~bwareaopen(x150_op,150); %area closing
    figure, imshow(~bwareaopen(x172_op,300); %area closing

Thus as we see we require a connected area opening filter which calculates connected grayscale componenets with a certain area. I think you can tune this for the books!

Another library that provides the same operator and some examples: http://www.mmorph.com/mxmorph/html/morph/mmareaopen.html

Best of luck!

Community
  • 1
  • 1
beedot
  • 652
  • 5
  • 12
  • Thanks for your suggestion, I have already tried this actually, but my school supervisor stopped me. He said he wants to avoid any tuning or need for adjustment. The reason is so that a normal person is just able to snap an image, and the computer will tell him the number of books. This method however requires fine tuning every time the images (different number of books, different books size) changes. – rockinfresh Oct 29 '13 at 18:18
  • Hey, Sure this is a valid comment and i agree that this requires some tuning of thresholds, but this is one time and should be robust. Here you can always pick the largest N grayscale components. More specifically here you need to count the number of largest grayscale components. And if there is threshold of area of noise components one can fix this. Also area filtering does not depend on the fact that you have books that are horizontal or slightly tilted, they are translationally and rotationally invariant. – beedot Oct 31 '13 at 17:07
1

Shai's recommendation to calculate the mean along each horizontal row of the image can help identify books. That method would have certain limitations if the books aren't flat, aren't horizontal, or have similar colors. However, rather than focusing on the clumps of similar brightness, you might instead consider using the horizontal mean/median or the like as a means to detect possible air gaps between books.

I wouldn't bother much with working in binary images. Too fiddly, and not very robust. You can find a solution for certain images, but could spend heaps of time trying to find a solution for all images. The clustering of grayscale intensities of this image is very important, and you don't want to throw that data away. Thresholding before binarization can be a messy and unsatisfying business.

Are you familiar with the mean shift algorithm? It's a clustering algorithm similar to k-means clustering, but doesn't require knowledge of the number of items (k) in advance. This could help you cluster the data in the original grayscale image and find that there are three large, distinct clumps of reasonably consistent grayscale value.

Image Segmentation using Mean Shift explained

http://docs.opencv.org/trunk/doc/py_tutorials/py_video/py_meanshift/py_meanshift.html

http://saravananthirumuruganathan.wordpress.com/2010/04/01/introduction-to-mean-shift-algorithm/

Community
  • 1
  • 1
Rethunk
  • 3,976
  • 18
  • 32
  • I have used Mean Shift before for other of my image processing work in OpenCV. From my experience, my only concern for using it here is that the possible air gaps between the books will be clustered together totally, as the gap is too small. Haven't tried using mean shift in MatLab yet. Since you think it will work, I will read up more on it and give it a try soon. Thanks for the suggestion. Will get back to you if it prove to be successful(May take awhile due to school assignments and exams coming up). Thanks once again (: – rockinfresh Nov 09 '13 at 08:19