I am looking for a way to overlay an x-y time series, say created with 'plot', on top of a display generated by 'contourf', with different scaling on the y-axes.
It seems that the typical way to do this in the case of two x-y plots is to use the built-in function 'plotyy', which can even be driven by functions other than 'plot' (such as 'loglog') as long as the input arguments remain the same (x,y). However, since in my case contourf requires three input arguments, 'plotyy' seems to not be applicable. Here is some sample code describing what I would like to do:
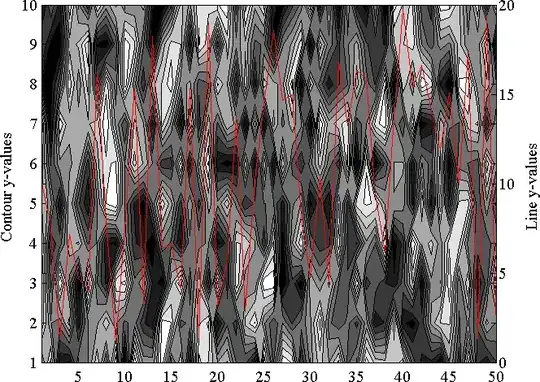
x1 = 1:1:50;
y1 = 1:1:10;
temp_data = rand(10,50);
y2 = rand(50,1)*20;
figure; hold on;
contourf(x1,y1,temp_data);
colormap('gray');
plot(x1,y2,'r-');
Ideally, I would like the timeseries (x1,y2) to have its own y-axes displayed on the right, and be scaled to the same vertical extent as the contourf plot.
Thanks for your time.