I haven't been able to find someone with a similar problem, and no clues to solve my problem reading the docs and other problems so I hope that some one can help me here.
This is my code (which is copied from the documentation example)
var margin = {top: 20, right: 20, bottom: 30, left: 150},
width = document.getElementById("aapp_content_charts").clientWidth - margin.left - margin.right,
height = 500 - margin.top - margin.bottom;

var x = d3.time.scale()
.range([0, width]);

var y = d3.scale.linear()
.range([height, 0]);

var xAxis = d3.svg.axis()
.scale(x)
.orient("bottom")
.ticks(3);

var yAxis = d3.svg.axis()
.scale(y)
.orient("left");

var line = d3.svg.line()
.x(function(d) { return x(d3.time.year(parseDate(d[0]))); })
.y(function(d) { return y(d[1]); });

var svg = d3.select("#aapp_content_charts").append("svg")
.attr("width", width + margin.left + margin.right)
.attr("height", height + margin.top + margin.bottom)
.append("g")
.attr("transform", "translate(" + margin.left + "," + margin.top + ")");


x.domain(d3.extent(list_indicators_3years_absolute['Gastos en activos financieros'] , function(d) { return parseDate(d[0]);}));
y.domain(d3.extent(list_indicators_3years_absolute['Gastos en activos financieros'] , function(d) { return d[1];}));

svg.append("g")
  .attr("class", "xaxis")
  .attr("transform", "translate(0," + height + ")")
  .call(xAxis);

svg.append("g")
  .attr("class", "yaxis")
  .call(yAxis)
    .append("text")
      .attr("transform", "rotate(-90)")
      .attr("y", 6)
      .attr("dy", ".71em")
      .style("text-anchor", "end")
      .text("(€)");

svg.append("path")
  .datum(list_indicators_3years_absolute['Gastos en activos financieros'])
  .attr("class", "line")
  .attr("d", line);
Now, you'd be wondering how my variable 'list_indicators_3years_absolute['Gastos en activos financieros']' looks like:
- From the console.log:
[Array2, Array2, Array2] 0: Array2 0: "2010" 1: 0 length: 2 proto: Array[0] 1: Array2 0: "2011" 1: 29999996.8 length: 2 proto: Array[0] 2: Array2 0: "2012" 1: 79204931.01 length: 2 proto: Array[0] length: 3 proto: Array[0]
- a more visual example of the variable:
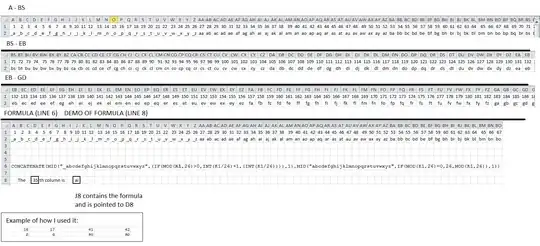
Yes, there are only 3 points, for the three years (x axis): 2010, 2011, 2012
And here how the error "line" chart looks like:
I think the error is in my variable structure, but I don't get any warning, or clue to find out what is problem. In fact, both axis are set and labeled correctly, and the three points as well. The weird thing is that the line seems to be closed from the last point to the first one, and filled up.
:-mmmmm
Thanks in advance!